Does it infuriate you when people conflate measurements of carbon and carbon dioxide? Do you know your ‘equilibrium climate sensitivity’ from your ‘transient climate response’? How about the relative importance of carbon dioxide, carbon monoxide and black carbon in terms of radiative forcing?
No? Join the club.
Very few people understand the nuts and bolts of climate science beyond the scientists themselves. And that is a real shame, because understanding climate change is important for everyone.
This post is an attempt to explain climate science to beginners. And when I say beginners I definitely include myself.
Where should you start?
The newly released summary for policy makers from the Intergovernmental Panel on Climate Change (IPCC) is the best place to read a 20 page summary of what we currently know about climate change. But if you can’t bear the 20 pages of bloodless text, this is a short guide that tries to explain how humans are warming the world. Written for humans. ![]()
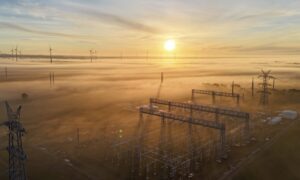
The world’s atmosphere has warmed about 0.85°C between 1880 and 2012. The oceans are also warming, absorbing 90% of the increased energy stored in the climate system. Ice cover in the Artic, Antarctica and Greenland is declining. Sea levels are rising, the ocean is acidifying and atmospheric concentrations of greenhouse gases are rising.
These are the ‘fingerprints’ of climate change. The measurements that show us the world is changing. The ‘what’ if you will. Climate science is the effort to explain ‘why’ the world is warming, and what we can expect in the future. This is what we are going to try and explain here using three ideas: forcing, sensitivity and pathways.
1: What’s forcing the climate to change?
Climate scientists measure the drivers of climate change using a metric called ‘radiative forcing’. This quantifies the change in energy fluxes at the top of the atmosphere due to different climate drivers. Substances with a positive forcing, like carbon dioxide, are those warming the earth. Whereas substances with negative forcing, like sulphate aerosols, are those cooling the earth.
The new IPCC report estimates total human radiative forcing in 2011 relative to 1750 to be 2.29 watts per square metre (W m–2). The following waterfall chart is an attempt to explain, as simply as possible, what the drivers of climate change are in terms of radiative forcing.
 This charts shows the relative importance of different compounds in heating and cooling the earth since 1750.
Emissions of carbon dioxide have been responsible for over half of the warming influences to date. Methane, carbon monoxide, halo-carbons and nitrous oxide also have a significant warming influence. The major cooling influences are NOx gases, aerosols (like sulphates and organic carbon) and changes in land albedo (how shiny it is). The effect aerosols have on clouds also has a large cooling effect, though there is significant uncertainty in quantifying this.
To keep this graphic as digestible as possible I have limited it to primary emitted compounds and point estimates for each forcing. The complete picture is much more nuanced and includes the varying levels of certainty, confidence intervals, drivers that result from each compound and differing atmospheric residences. You can read all that fun stuff in the summary for policymakers.
2: How sensitive is the climate?
Now that we have an idea of what is driving climate change, it is time to discuss how much these ‘forcings’ will change the earth’s surface temperature. For that we’ll have to drop the S-bomb: ‘sensitivity’.
Sensitivity is how much we expect the world to warm for a given forcing, often defined as a doubling of atmospheric CO2 (4 W m–2). Using a mix of paleoclimate data, observations and computer models climate scientists estimate how sensitive the climate is to a given climate forcing.
If you ever find yourself discussing climate sensitivity in a pub, be sure to define it before you get too many drinks in. Because you don’t want to confuse transient climate response (decades), with equilibrium climate sensitivity (centuries) and earth system sensitivity (millennia).
To keep this explanation simple, we’ll just look at two types of sensitivity, equilibrium climate sensitivity (ECS) and transient climate response (TCR).
 Equilibrium climate sensitivity is how much we would expect the world to warm if we doubled atmospheric CO2 and waited a few hundred years for the climate reach a new equilibrium. The IPCC’s latest estimate is:
likely in the range 1.5°C to 4.5°C
Transient climate response is the temperature we expect at the time carbon dioxide concentrations have doubled if they increase at 1% per year. The IPCC says it is:
likely in the range of 1.0°C to 2.5°C
If you are interested in looking at what is happening over the coming decades then TCR is more relevant. Whereas for discussions about climate stabilization targets ECS is the preferred metric.
A major reason for the difference between these two values is the slow speed with which heat absorbed by the oceans is eventually released to warm the atmosphere. The uncertainty for each involves things like the ocean mixing of heat, differences between surface and atmospheric warming, water vapor and cloud formation feedbacks.
For any estimate of climate sensitivity it is crucial to understand the time frame and which feedbacks are included.
3: Which pathway will we choose?
The world is going to warm this century, considerably. That is what the science tells us. But just how much it is going to warm is uncertain due to a number of things.
These uncertainties include the future path of emissions of greenhouse gases and aerosols, land and ocean sink function, ocean heat mixing and the extent of various feedbacks.
To give us an idea of what to expect this century the IPCC’s fifth assessment report uses what they called representative concentration pathways (RCP). Each of the four RCPs are named after their approximate total radiative forcing (W m–2) in 2100 relative to 1750. The four RCPs are 2.6, 4.0, 6.5 and 8.5 W m–2. Each of which are higher than the 2011 estimate of 2.29 W m–2 we saw earlier.
In simple terms these pathways range from rapid mitigation (RCP 2.6) to runaway emissions (RCP 8.5). Bringing together a wide ensemble of climate models that involve different forcing and sensitivity estimates the IPCC has given us an idea of how much it thinks the world could warm this century for each pathway.
 For the rapid mitigation pathway (RCP 2.6) the expected warming this century is 1.0°C (the likely range is shown in the bars).
For the fast stabilization pathway (RCP 4.5) they expect 1.8°C of warming.
For the slower stabilization pathway (RCP 4.5) the mean estimate is 2.2°C.
And for the runaway emissions scenario (RCP 8.5) it is 3.7°C.
This warming is on top of the 0.6°C observed up to the 1986-2005 reference period, so in every case but the rapid mitigation scenario (RCP 2.6) the temperature is expected to warm beyond 2°C above the pre-industrial period. It is also worth remembering these are surface averages, so areas over land and northern latitudes would likely fare far worse (See figure SPM.8).
So there you have it. Climate science works out what is ‘forcing’ the climate to change. Estimates how ‘sensitive’ the climate is to those changes. And models how much warming might occur under different emissions ‘pathways’.
Clear as mud? Time for that drink.
This article was originally published on Shrink That Footprint. Reproduced with permission