The Conversation
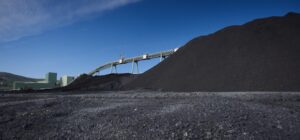
At 9.40 am local time on Monday May 9th the turbines at Alinta’s 520 megawatt Northern Power Station at Port Augusta disconnected from the grid for the last time.
And with it ended more than 50 years of coal-fired power generation in South Australia.
But Northern’s shutdown does not mean that South Australian power supply is coal-free, and it is unlikely to mean that its power consumption is less carbon-intensive, at least in the short term.

Not long after Northern shutdown, other lights went out across South Australia as storms left a trail of destruction across the network – the weather gods seemingly whipped into a frenzy of excitement.
By early the following morning a new benchmark had been set with wind-power touching 90% of the dispatch onto the South Australian grid.

The electricity market followed suit, with spot prices rising to $400 per megawatt hour as Northern’s last turbine was shut down, to $480 shortly after, before descending as low as -$34 the following morning.

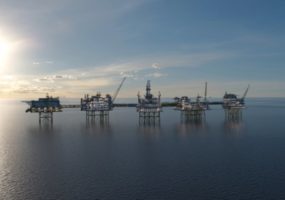
With power flows across the nation responding to the changing circumstances in South Australia, connected markets followed the merry dance. Across the mainland states, wholesale prices averaged a bit over $90 per megawatt hour across the 29 hour period shown here, about double what we would expect for a typical Autumn weekday. Natural gas did particularly well, returning an average of more than $100 in each of the mainland jurisdictions.


With the exception of the early hours of Tuesday morning, when the wind generators were firing at 90% capacity and demand was at its lowest, South Australia was importing significant quantities of power from Victoria. Imports topped out at a touch over 600 megawatts in the first few hours after Northern’s shutdown. At the average rate of 194 megawatts across the period, imports accounted for about 15% of South Australian demand.

By way of replacement, and notwithstanding some proposed withdrawals, South Australia has plenty of registered gas-fired power capacity to more than account for the demise of Northern, as evidenced by the fact that gas was dispatching at only around 15% of the registered capacity for the 29 hour period.

While there is no apparent short-term risk to supply, South Australian gas generators will be competing with imported Victorian brown coal generators to pick up any deficit left by Northern’s shutdown.
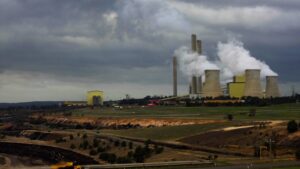
And because the Victorian coal generators are the least expensive on the national market, Northern’s shutdown will, to a large extent, be underwritten by the Latrobe Valley.
As is typically the case, in the hours after Northern’s shutdown Victoria was exporting power both to South Australia and to New South Wales (and if Basslink were not broken, it would no doubt be doing so to Tasmania), at the combined total of about 800 megawatts. That is just a bit less than the typical output of Hazelwood, the country’s most emission intensive power plant at 1.56 tonnes CO2 per megawatt hour sent out power, or Yallourn with an emission intensity of 1.49. In comparison, Northern’s emission intensity is listed at 1.13 by the market operator.

So to the extent that Northern’s output is underwritten by the Latrobe generators, there will unlikely be any net CO2 reductions across the grid due to Northern’s retirement. In fact, there may be an increase.
Whatever, South Australian power supply is definitely not yet coal-free.
More interesting will be how the change in structure of South Australian power supply effects wholesale prices in times of high demand and low winds. If local prices are to be set by more marginal gas, there will be upward pressure on price and volatility. To some extent, that tendency will be offset by the 190 megawatt upgrade in the Heywood interconnect capacity due for completion in the next month or so, which will expand the capacity to import even more of Latrobe Valley’s output in times of need, while allowing for greater export of wind power in times of surplus.
Recent years have seen relatively subdued wholesale power price volatility across the southern states. However, we do not have to look far back in time to see just how sensitive volatility is to changes in supply and demand settings. The years 2007 and 2008 at the height of the Millennium Drought are a case in point. Then South Australian prices averaged almost $63 per megawatt hour and, for the best 5 hours of each day, averaged about $190. By comparison, for 2014 and 2015 the average price was $49, with the best 5 hours of each day yielding just $89.

Any possibility of a return to 2007-08 pricing regimes following Northern’s closure would no doubt excite interest in new investment, especially in grid-scale storage. If one believed those prices would be sustained over the long haul, then solar thermal power configured with about five hours molten salt storage, such as being proposed by Solar Reserve, would be an attractive offering. Of course, that would very much depend on how gas prices play out in the future, whether one believes there will be a carbon price, what happens to the RET beyond 2030, and just how much other investment is being considered.
Paradoxically, without new South Australian investment in technologies that help balance wind power’s intrinsic variability, the shutdown of Northern will further cement the Latrobe Valley as the backbone of the Australian electricity system. And that will be grim for the nation’s emissions trajectory.
The fading of the Northern lights illustrates once again the need for an integrated approach to managing the much needed transition to a less emission intensive power supply across the nation.
Mike Sandiford is a Professor of Geology, University of Melbourne. He receives funding for low emissions energy research, including integration of renewables and CCS, as well as from the ARC for geological research into plate tectonics.
This article was originally published on The Conversation. Re-produced with permission.