Australia’s NEM is increasingly operating as a renewables-and-storage system, with fossil fuels, particularly gas, associated with the costly end of the market.
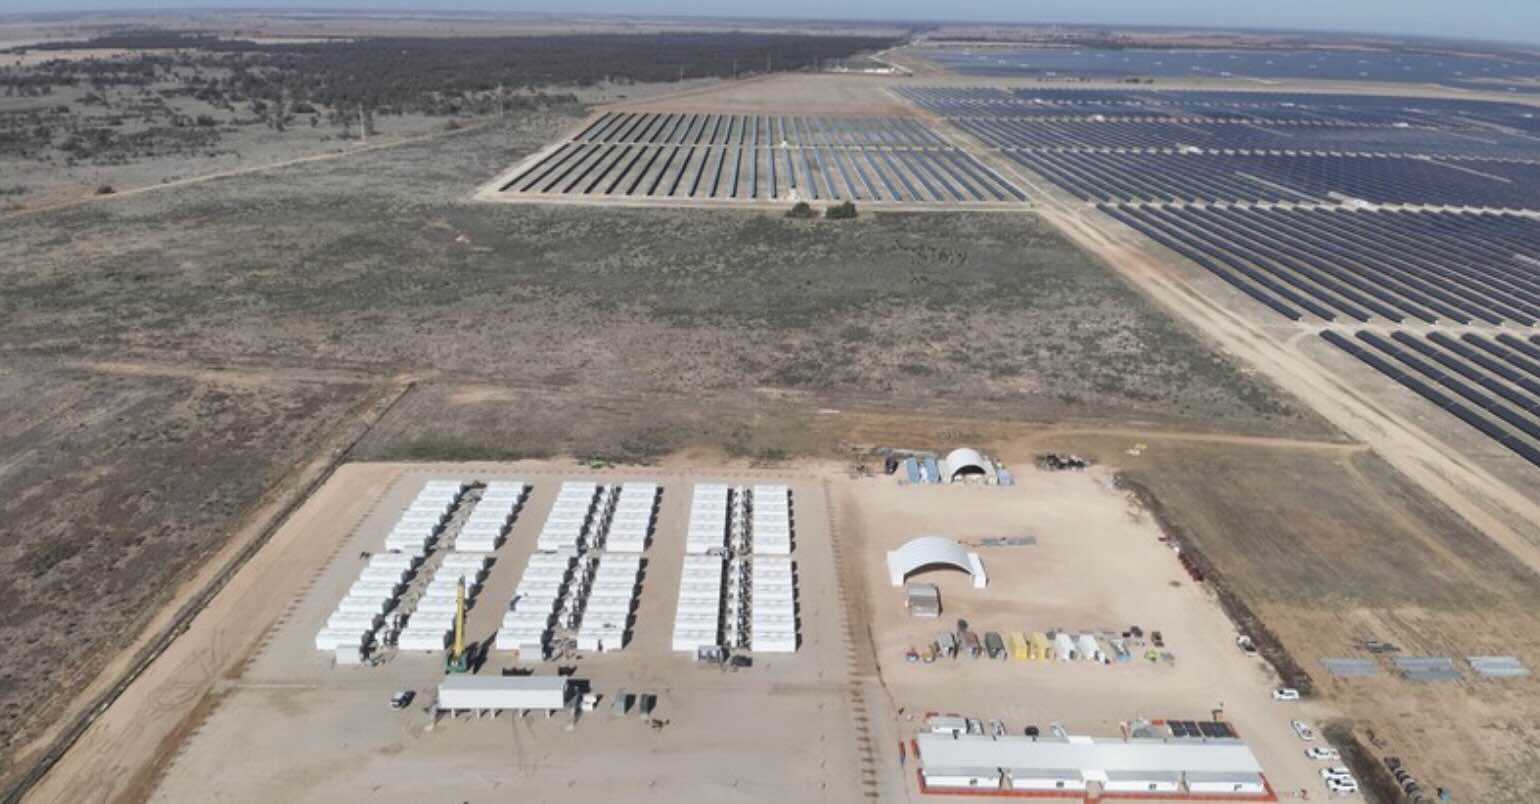
Daily battery discharge has risen from only 1-2 gigawatt-hours (GWh) in early 2024 to frequent 15-20 GWh days by mid-2026, with recent peaks above 20 GWh (Figure 1).
That is the time-proven case we outlined earlier this year – batteries are no longer merely ancillary assets, they are increasingly shifting renewable generation, especially solar, into higher-value evening periods and displacing gas peakers.

Figure 1. Australian National Electricity Market electricity from daily utility battery discharging 2024-2026 – AEMO data to 13 Aug 2026
In 2024, battery shares were mostly below 0.5% and high price outcomes were common (Figure 2). With massive growth through 2025 and continuing into 2026, daily battery shares frequently exceed 1.5-2.5%, occasionally reaching around 3.5%, while the dense cluster of outcomes is generally around $A40-100/MWh (Figure 2).
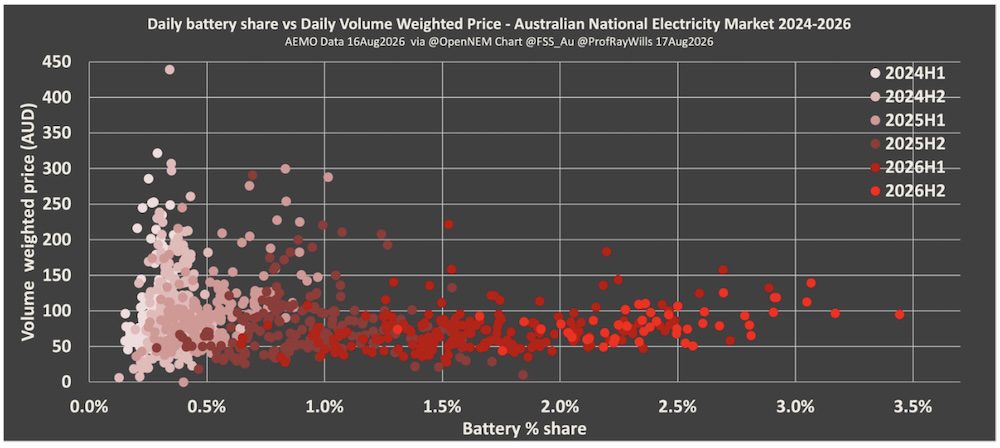
Figure 2. Daily battery share vs Daily Volume Weighted Price stratified by half years – AEMO data 2024-2026
This is not proof that batteries alone determine prices, but it is consistent with their growing role in removing high-price, gas-set intervals from the volume-weighted average (Figure 3).
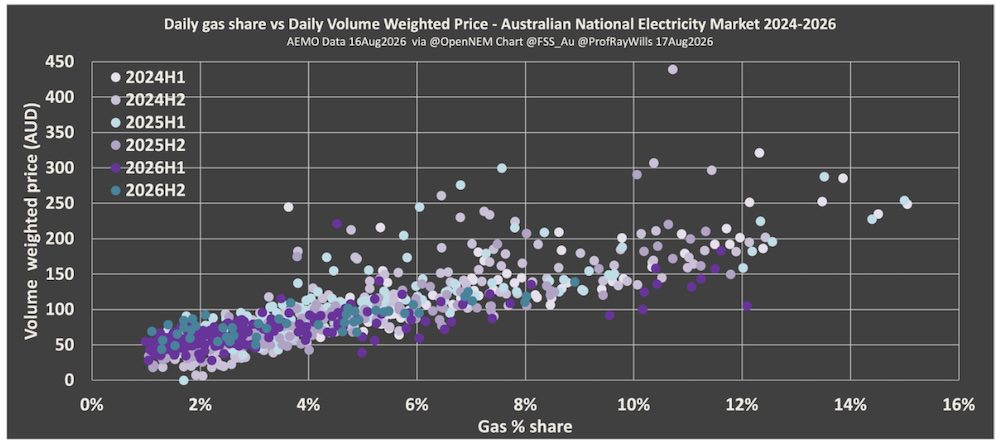
Figure 3. Daily gas share vs Daily Volume Weighted Price stratified by half years – AEMO data 2024-2026

Figure 4. Daily renewables share vs Daily Volume Weighted Price stratified by half years – AEMO data 2024-2026
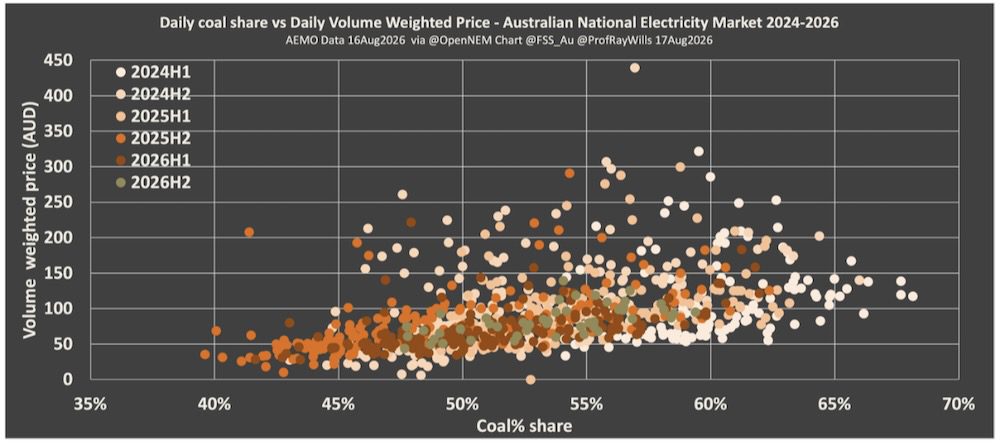
Figure 5. Daily coal share vs Daily Volume Weighted Price stratified by half years – AEMO data 2024-2026
The price pattern is clear
Across updated scatterplots, the relationships align with our earlier analysis:
– Higher renewable shares above 50% bring lower daily prices below A$100/MWh (Figure 4);
– High coal shares remain associated with a wider and more expensive distribution of outcomes (Figure 5);
– Price rises strongly with gas share; the largest daily price spikes (pricing volatility) remain concentrated on higher-gas days, and conversely the lowest prices occur when gas share is contained (Figure 3); and
– Greater battery dispatch coincides with a lower, tighter price band despite their still modest energy share (Figure 2).
A consistent transition
As renewables and batteries expand, they reduce exposure to fuel-driven price spikes and push gas toward a diminishing high-cost role.
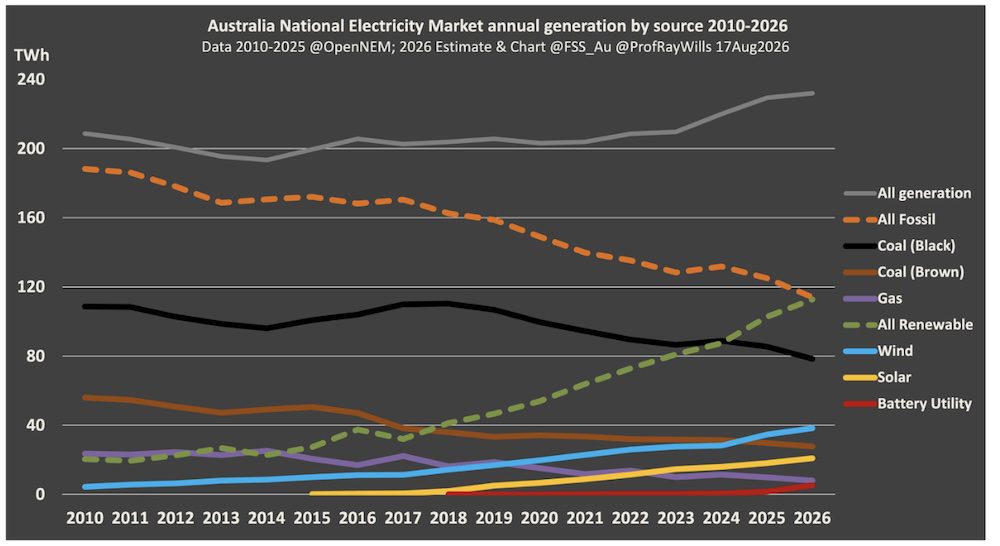
Figure 6. Australia National Electricity Market annual generation by major source 2010-2026 – AEMO data 2025 via OpenElectricity
The 2026 data adds weight to the case that “solar daylight saving” – charging batteries in abundant daytime solar and dispatching later – is now a material market force, and no longer just a future promise.
Once battery capacity is sufficient, there will be no role for gas.
To join more than 29,000 others and get the latest clean energy news delivered straight to your inbox, for free, click here to subscribe to our free daily newsletter.