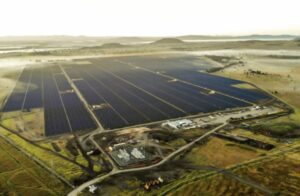
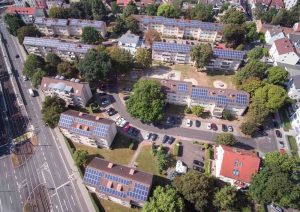
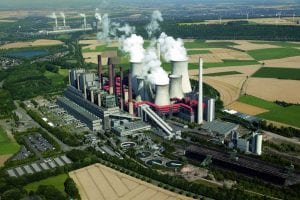
Each of the state governments of Victoria, Queensland and New South Wales have a clear, public, planned replacement of coal-fired generation with renewable power.
That’s the good news – and very good news it is, vastly ahead even compared to the public position three to four years ago.
But this has been done at the expense of the national electricity market (NEM) and, if not with a “beggar my neighbour” approach, certainly with the first, second and third priority being the state interest.
The production of wind and solar in the NEM has grown about 140% since 2017; although to be sure the growth rate has slowed to 10-12% in the past couple of years and over the past 12 months has been “only” 25% of total production.
However, and for whatever reasons, each of the three big producing states – Victoria, Queensland and NSW – are developing programs that first and foremost benefit their own state.
Queensland, in its most recent announcement, plans to put more transmission in Queensland and basically to create a bigger and stronger link from between the north and the south of the state. About 75% of the at least $60 billion Queensland plans to spend will be owned one way or another by the state government, mostly via its wholly owned electricity generation business and the state-owned transmission company.
Victoria plans to build offshore wind and, in the process, de-emphasise onshore wind. Victoria will subsidise the offshore wind.
NSW plans to build renewable energy to replace most, but not all, of the state’s coal generation and would like to become more self sufficient – but at least on the announced plans it will continue to require net imports.
In this note we argue that the Australian Energy Market Operator’s Integrated System Plan (ISP) broadly gets it right, in the sense that Queensland will likely, in the long-term, have cheaper electricity than Victoria, and so it is natural to expect a larger share of NEM electricity production sourced from Queensland and, equally, to expect Victoria’s share to sink.
For Victoria to replace brown coal with offshore wind and batteries will lead to Victoria’s NEM-wide RELATIVE costs increasing, but Queensland’s relative position will improve. As a consequence, we expect energy-intensive industry to move from south to north, all else being equal.
Queensland has better renewable resources than Victoria
Historically, Victoria had lots of energy intensive manufacturing because brown coal was cheap, even if the power stations weren’t, and then because of Bass Strait gas.
Victoria, however, has a relatively poor solar resource and its wind resources are also a below those of Queensland. These are broad comments and no doubt there are many exceptions. The Kiata wind farm, for instance, has historically had just about the highest capacity factor any wind farm on the NEM, but it’s very small by today’s standards.
An equally weighted average of the capacity factor for each renewable energy zone (REZ) summarised by month is shown below:

The wind capacity factors are a simple average for each zone of the high and low series that AEMO provides by half hour. The solar capacity factors are for a single axis tracking system. I can’t find the exact DC/AC ratio used (sometimes known as the ILF = Inverter Load Factor) but the Aurecon 2020 technical review provided to AEMO suggested about 1.2.
The chart also shows the highest capacity factor Victorian REZ for solar. The year-long average is good, but there is still strong Winter decline increasing the Winter firming need in Victoria. Adding in rooftop solar will only make this point that much more obvious.
You can see where I’m going here. Victoria needs night time Winter firming. It’s then a question of the “best” way to provide that. I used to think that “best” meant lowest cost, but in the world of state politics it seems that’s not necessarily how best is operationalised.
Using the averages, Queensland wind is less volatile than in Victoria. And it’s the volatility that drives the amount of firming needed – and which is a major driver of the overall cost of the system.
The ISP takes care of that from a pure economic point of view by building wind and solar in the most economic zones after allowing for transmission costs.
But of course, and this is half the point of this note, the politics determines that things are done for what I kindly describe as “political” reasons. That is, for social license, jobs, state governments looking after their own interests and so on and so forth.
In the ISP, virtually no new utility solar is built in Victoria. The VRET shows that this isn’t how it works.
Overall, using the ISP step change data and the capacity it installs in each REZ, here is a very rough graph of the moving average of VRE for the three major states in, say, 2032 – expressed as an index.

You can clearly see the low monthly volatility in Queensland, and also the different seasonality, compared to NSW. Queensland remains quite strong in Winter and drops off in Summer. To my way of thinking, this makes Queensland a much better candidate for batteries and a worse candidate for seasonal storage as compared with, say, Victoria.
The above figure is created from the onshore wind and solar that AEMO’s ISP allocates to each state. Victoria can almost certainly reduce its volatility by proceeding with offshore wind, but the cost will still end up being higher for consumers than in Queensland.
Bluntly, if I was running an energy intensive business like an aluminum smelter or potentially green hydrogen, it makes far more sense from an energy cost perspective to do it in Queensland, rather than in Victoria.
It might be that this could be altered by either Tasmanian hydro or Snow 2.0. The figure above is based, as I say, on the ISP – and the ISP is a cost-based model, not one that factors in politics or jobs. So the Queensland energy plan has far more transmission built within Queensland and moves much of the wind production north of where the ISP wants to build it in the Darling Downs.
The upshot is that the transmission costs will be higher. Even so, Queensland will still have a substantial advantage, most likely over Victoria and probably NSW. NSW’s within-state production will be worse than Queensland, but NSW could benefit from the transmission network which could continue to allow competition between other states, including South Australia now, to supply power to NSW.
NSW 35TWh of tenders v 49TWh of coal generation
The NSW plan is for 35 TWh of new VRE to be tendered by 2030. And while the plan has been slightly modified, it’s basically as shown in this figure from 2021.

The tenders aren’t at the moment generally awarded until some months after submission and then there will be, typically, a two-year delay between tender and commissioning.
35 TWh of tenders compares with 49 TWh of coal generation in NSW in 2021.
In NSW, the state self-imposed reliability standard, as supported by the Waratah Super Battery, does emphasise – at least implicitly – the ongoing role of interstate supply. NSW is using AEMO as the NSW Customer Trustee. So to this extent NSW is far more wedded to the NEM, in my opinion, than Queensland or Victoria.
Queensland – most of the action is post 2028
Despite all the (justified) excitement and importance of the Queensland program, it depends on the Borumba pumped hydro and the transmission infrastructure. More to the point, it really doesn’t pick up pace from the current rate and even slows down until 2028. Six years is a long, long time in electricity markets.

In terms of electricity prices it’s a long time until 2028. Naturally, at this early stage, it’s not clear whether the above table refers to development or installed and commissioned capacity. The status doesn’t matter to the long-term plan, but it matters a lot to demand, supply and prices in the relevant year.
In any event, the Queensland Energy and Jobs Plan has almost no mention of the NEM or Queensland’s role in it. Imports and exports are barely mentioned.
The distinguishing feature of the Queensland plan is virtually the entire thing is going to be funded by the Queensland government or very roughly to the tune of 75% of the starting $60 billion target. In this transition the great virtue of government ownership is control. The Queensland government can build the new supply and then close down the state coal generators when, and only when, they can safely be closed.
I am not a fan of government ownership, but even a capitalist like me can see the virtue of a single manager during this transition. However, the benefits of competition in the new supply side of things are lost. Maybe there is something better than Borumba or the Burdekin pumped hydro.
Victoria
Victoria’s mainstream targets of 50% renewable by 2030 were ambitious when first announced but now at 50% by 2030 they are well off the notional federal target of 80% by 2030. As well as the VRET, Victoria also has a battery storage target (2.6 GW by 2030 and 6.3 by 2035) and an offshore wind target (2GW by 2030 and 6 ]GW by 2035).
In Victoria, as in NSW, all the coal generation is owned by the private sector and, of course, Yallourn’s closure is already locked in. AGL has announced Loy Yang A to close by 2035. Loy Yang B, a smaller but fully modernised power station that has already shown it can ramp like a champ, gets all of its coal from the Loy Yang A mine. However AGL, as the owner of the coal, has an unequivocal obligation to keep supply the coal until probably 2040 or beyond, should LYB still be operating then.
Again, though, the observation is that the coal closures are clustered in the period beyond 2025 and the bulk of the new battery and offshore wind is targeted in the 2030-2035 window.
I would argue that both Victoria and Queensland’s programs are almost transparently designed to protect state interests.
Notionally about 3GW of VRE + 1 GW of firming can cover 1GW of brown coal generation, given that the latter operates at an 85% capacity factor, maybe more in a good year, but equally is increasingly prone to breaking down.
However the point I want to make is that it might be more sensible to replace LYA and Yallourn with more production in Queensland. This is what happens in the least-cost ISP model. Instead of more high-cost firming produced entirely within Victoria, the state could take advantage of the South Australian, NSW and Tasmanian resources, some of which require more transmission.
The transmission benefits flow both ways of course. Even with an eye on South of Australia rather than just Victoria, though, it’s still likely that a VRE based system will be cheaper in Queensland. The caveat to that is that Queensland currently has next to no hydro resource.
And so, in the end, more interstate transmission would let the variable renewable energy (VRE) be produced in Queensland and take advantage of the hydro in NSW, Victoria and Tasmania.
The problem with that, from a state perspective, is that it means the relocation of some jobs, GDP and investment from one region to another. It’s the opposite of NIMBYism and becomes MIMBYism – “Must be in my back yard.”


