Over the past 12 months commodity prices have gone to levels either rarely or never seen. That might be iron ore, it might be LNG/gas, it might be steel, or even lithium.
The reason for this is obvious, production was cut back at the start of 2020 and has been slow to respond to the unexpected fast recovery from Covid. Bust and boom is a familiar thing in commodity markets, but it is not generally as compressed as in the past 12 months.
In addition for carbon emitting products there is a new and likely ongoing reluctance to invest in new production. Who wants to build a 25-40 years life gas storage facility or expensive offshore oil field when the world is moving to zero carbon over the life of the asset.
If the prices are high enough people will take the risk, but the cost of capital is probably double what it used to be even 10 years ago.
Meanwhile, for all the new age commodities like lithium, demand is exploding much faster than production. No-0one should be surprised by this. The entire lithium industry has told anyone who wanted to listen that expanding lithium production is hard work, takes time etc.
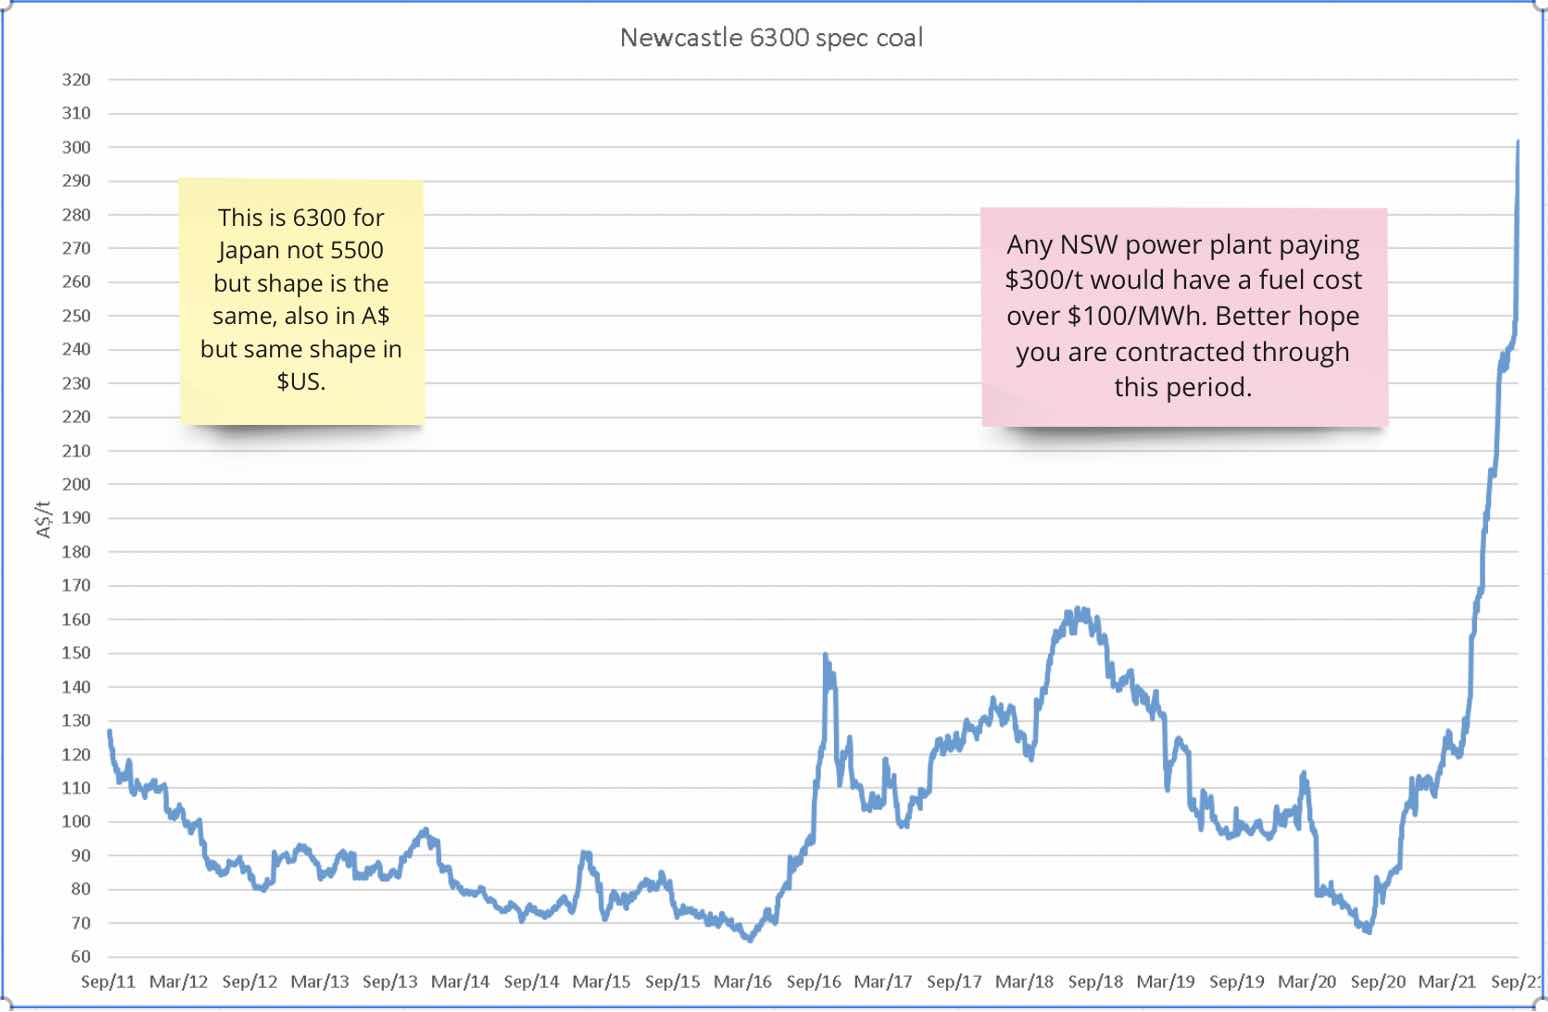
Nowhere is this supply squeeze felt more sharply than in coal and particularly thermal coal. Even in real terms the price is at pretty much an all time record.
China’s thermal electricity industry is most of the thermal coal problem
In general China is 50% or more of the world’s supply and demand of many basic commodities. Because of the absolute size of China in these markets, these days supply and demand issues there are different to those that applied in other developing countries.
Many countries have had high and volatile growth rates, but that didn’t drive global issues to the same extent because the absolute size was a lot smaller.
In Japan in the 1970s, or Malaysia and Thailand that had a growth spurt in the ‘80s, it was of great importance to their own people, but it didn’t impact the entire world. China in this respect is different.
According to the English language statistics published in China, and some other sources and using my own estimates for 2021 based on the first 8 months of the calendar year, electricity and coal development in China from 2015 looks as follows:

There is a lot to unpack in this table. For reference, the US consumes about 4000TWh, so China has added thermal electricity production in 6 years equal to about half of what the US consumes each year.
China has made progress in solar PV, in wind and even in nuclear, but the increase in coal fuelled electricity is bigger than the increase in all three of the others combined.
For this note though, I was more interested in the coal side of things. It takes a while to work through and you can’t directly used the China Stats data. Ryna Cui, from University of Maryland, provided an English exec summary of coal gen plan study by the North China Electric Power University and NRDC. This provided the historic data for standard coal.
Standard coal is a concept peculiar to China. Most thermal coal in China is rated at 5,500 kcal/kg which works to about 23GJ/t on “high” heating energy. By contrast, standard coal according to Lawrence Barkely Lab is about 31.5Gj/t. So when the electricity industry talks about 1.330 mtce (million tonnes of coal equivalent) they really mean about 1.8 billion tonnes of real world coal.
And in 2021 pretty close to 2 billion tonnes is required, or between 150 and 200 million more tonnes than than in 2020. Now, where was China going to get that from?
China coal supply and demand
After some stumbling and fumbling I ended up with the following summary of the coal supply and demand in China .

The key analytical conclusions are:
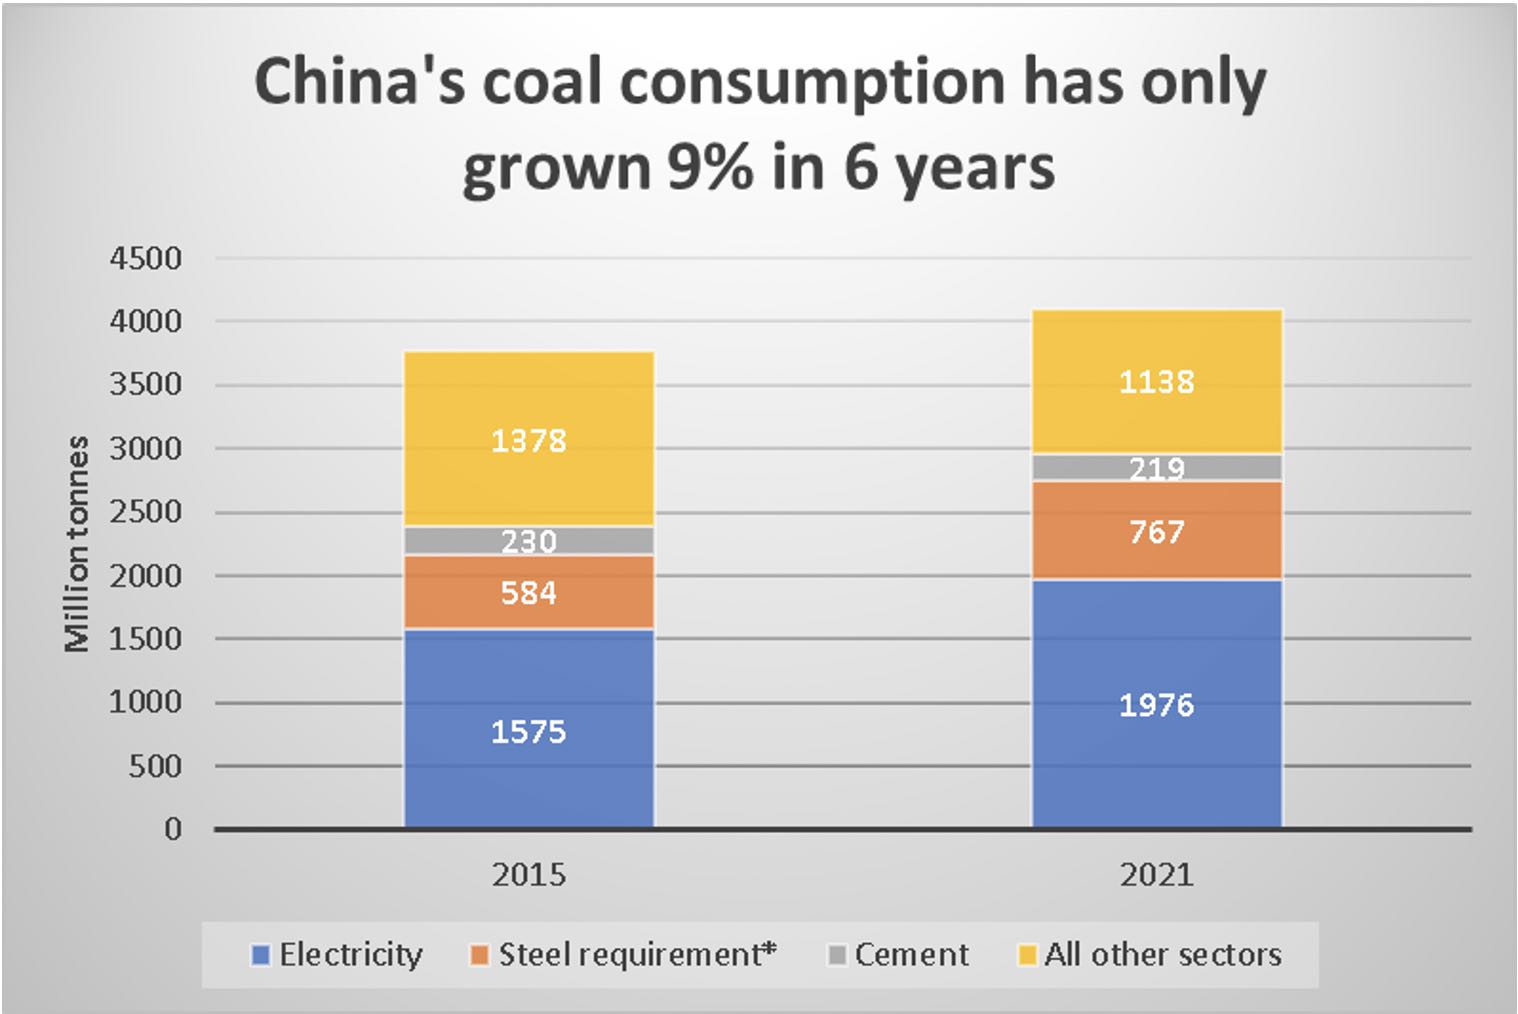
- Coal fuelled electricity has grown 44% 2015-2021, but total coal consumption is only up 10%. And to put it another way domestic coal production has only grown by a net 10% in six years. Imports have grown a lot in percentage terms, but the absolute number is relatively small.
- Steel, which mainly uses metallurgical coal, has also grown its demand by 31%.
- Cement uses double the amount of coal actually shown, but half of it is in cement grinding and so is included in the electricity number. Cement grinding is 100 KWh/t since China produces about 2.3-2.4 billion tonnes of cement, about 55-60% of total world production, its electricity requirement for cement grinding alone is about 230TWh, i.e. bigger than Australia’s electricity consumption. I’ll return to cement below, as it too is interesting.
- China has essentially found coal needed for electricity by reducing its use in other sectors such as residential heating.
- Although it doesn’t show in the data, one could reasonably assume that old coal mines wear out and have to be replaced. If we assumed a 25 year average mine life, and that’s optimistic for such a large volume of coal where inevitably the average quality won’t be that good because the industry is taking what it can get, if we assume a 25 year life that represents a 4% per year replacement or 150 mt of new development just to replace the old, never mind growing.
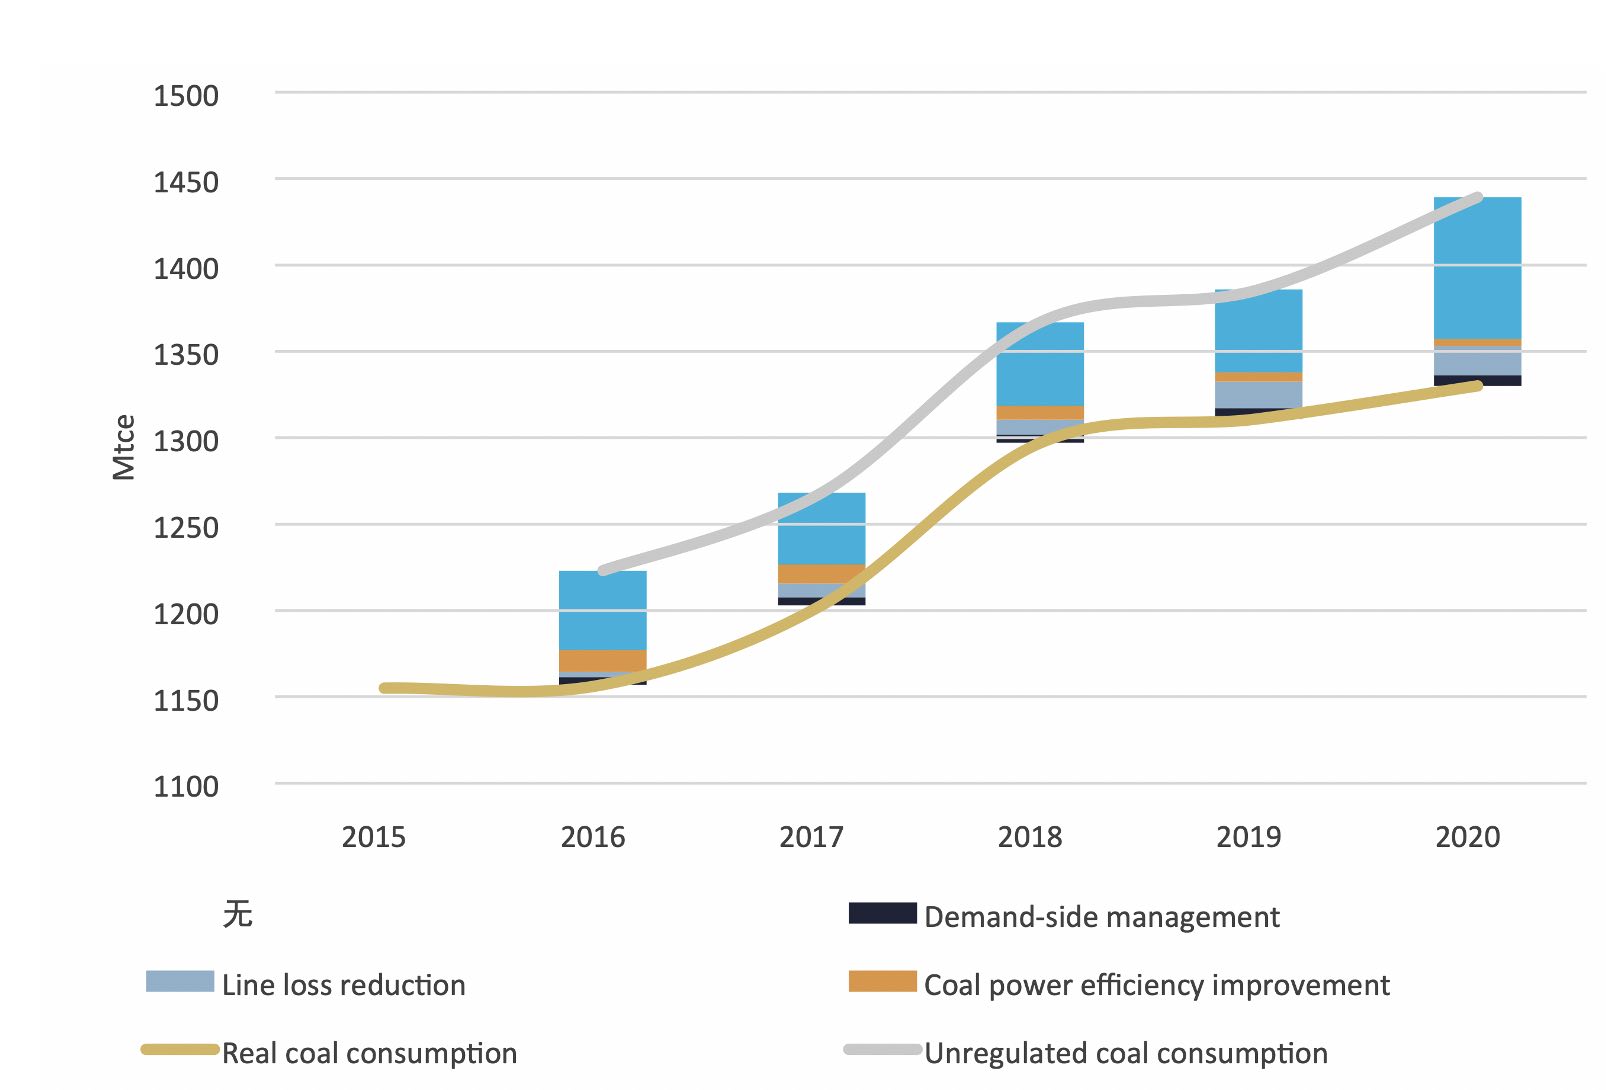
The above can be shown in a chart.
On the one hand, from a carbon emissions perspective, it’s wonderful that the 40% expansion in coal electricity and steel has only led to a 9% increase in coal consumption.
On the other hand, the ability to take from other sectors to feed the thermal electricity industry has clear limits, and I’d argue it’s showing up in 2021.
Conclusion: Future looks bright for Australian energy intensive production
So the key insight is this: From here on in, to grow China’s coal fuelled electricity production by 10% takes about 200 million tonnes more coal. That’s going to be hard to get even before considering that global warming has vastly increased the cost of capital for coal mining, and so the coal will be expensive and essentially leave China as a relatively high cost electricity producer into the foreseeable future.
So, provided energy intensive countries like Australia – with unlimited access to lower cost renewable energy – can stay the course for the next few years until China accepts its ultimate losing hand in energy intensive manufacturing, then the future looks good.
One caveat to this is energy density, or transmission. Even if the cost of electricity at the generation level is high for China they can compensate to an extent by requiring less transmission investment per unit of consumption.
Doing a proper study on this sort of thing might be something ARENA could usefully do, instead of stuffing round with so far uneconomic carbon capture and storage garbage.
China will lower its energy intensity when residential construction falls over
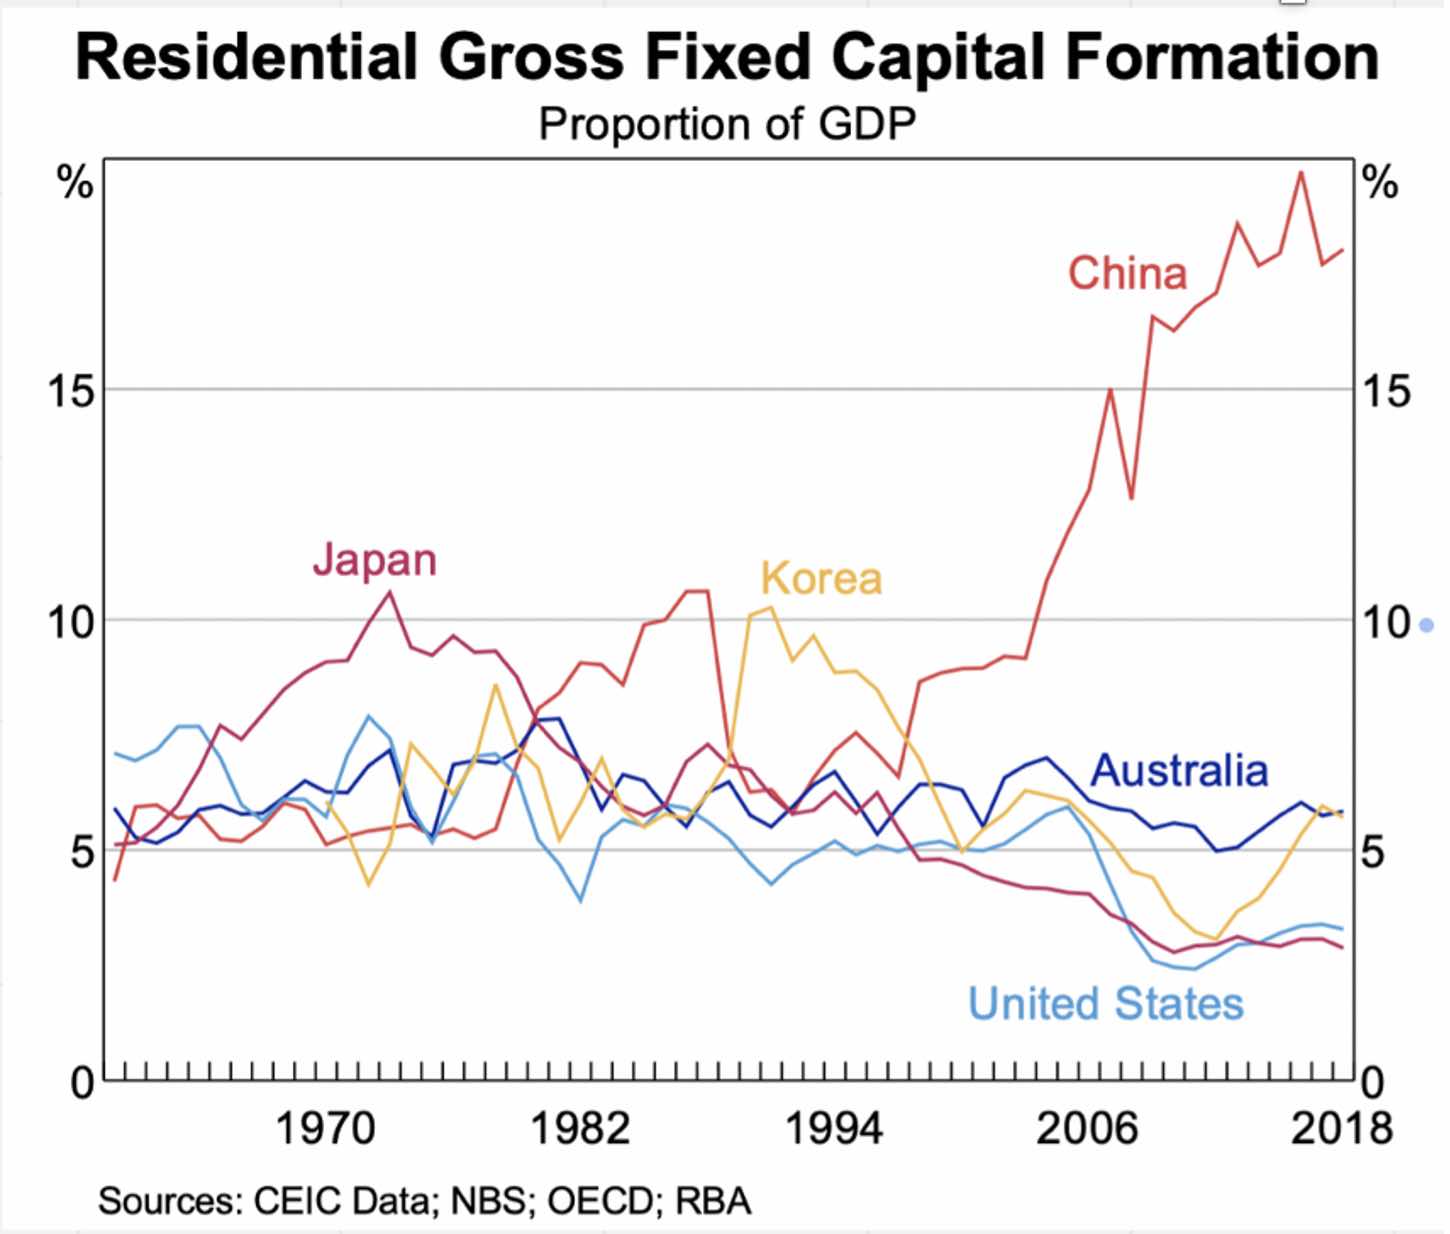
China’s economy is absurdly dependent on residential construction, and the associated commercial construction. The best chart I’ve seen to show this is from the Reserve Bank last year:
I have successfully predicted two out of the last zero housing recessions in China, as I didn’t understand that China can kick the can down the road as well as the next country.
As mentioned, China produces about 55%-60%% of the world’s cement and virtually all cement is used in construction of one kind of another.
About 1/3 of steel production is used in construction.
So, if construction slows down that will lead to lower coal consumption indirectly.
Leitch’s rule, having been a building materials analyst since about 1980, is that all housing booms end badly, whether it’s Florida, Spain, Ireland or eventually China.
One of the factors, and this requires far more work than than I have time for, or desire to do, is that in China most of the housing development is financed off the plan. But China’s property developers have no requirement to use the deposits or other money taken for the actual development.
They can use the money to pay off other debts. This creates a big incentive to announce and pre sell projects, but not actually build them.
You can actually see this in the cement data, although I am hesitant to draw conclusions.
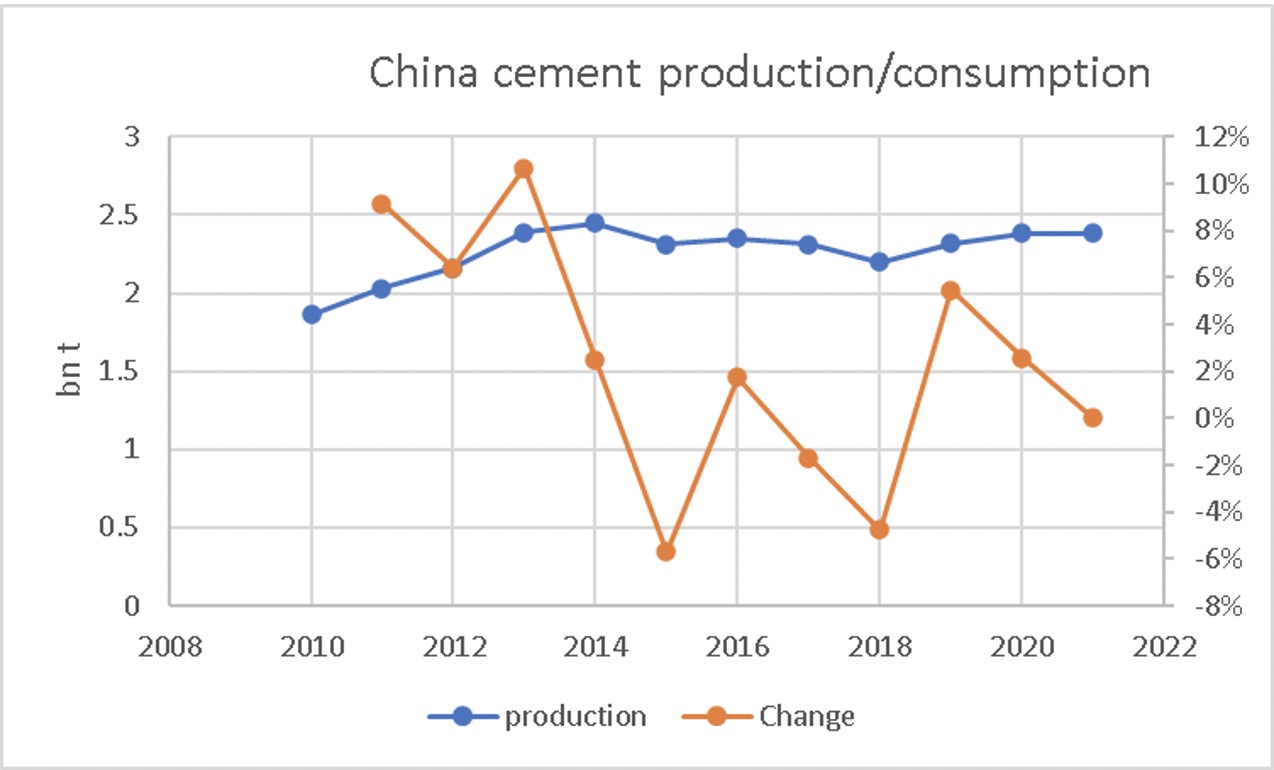
A very smart, ex investment banking colleague sent me the following chart:
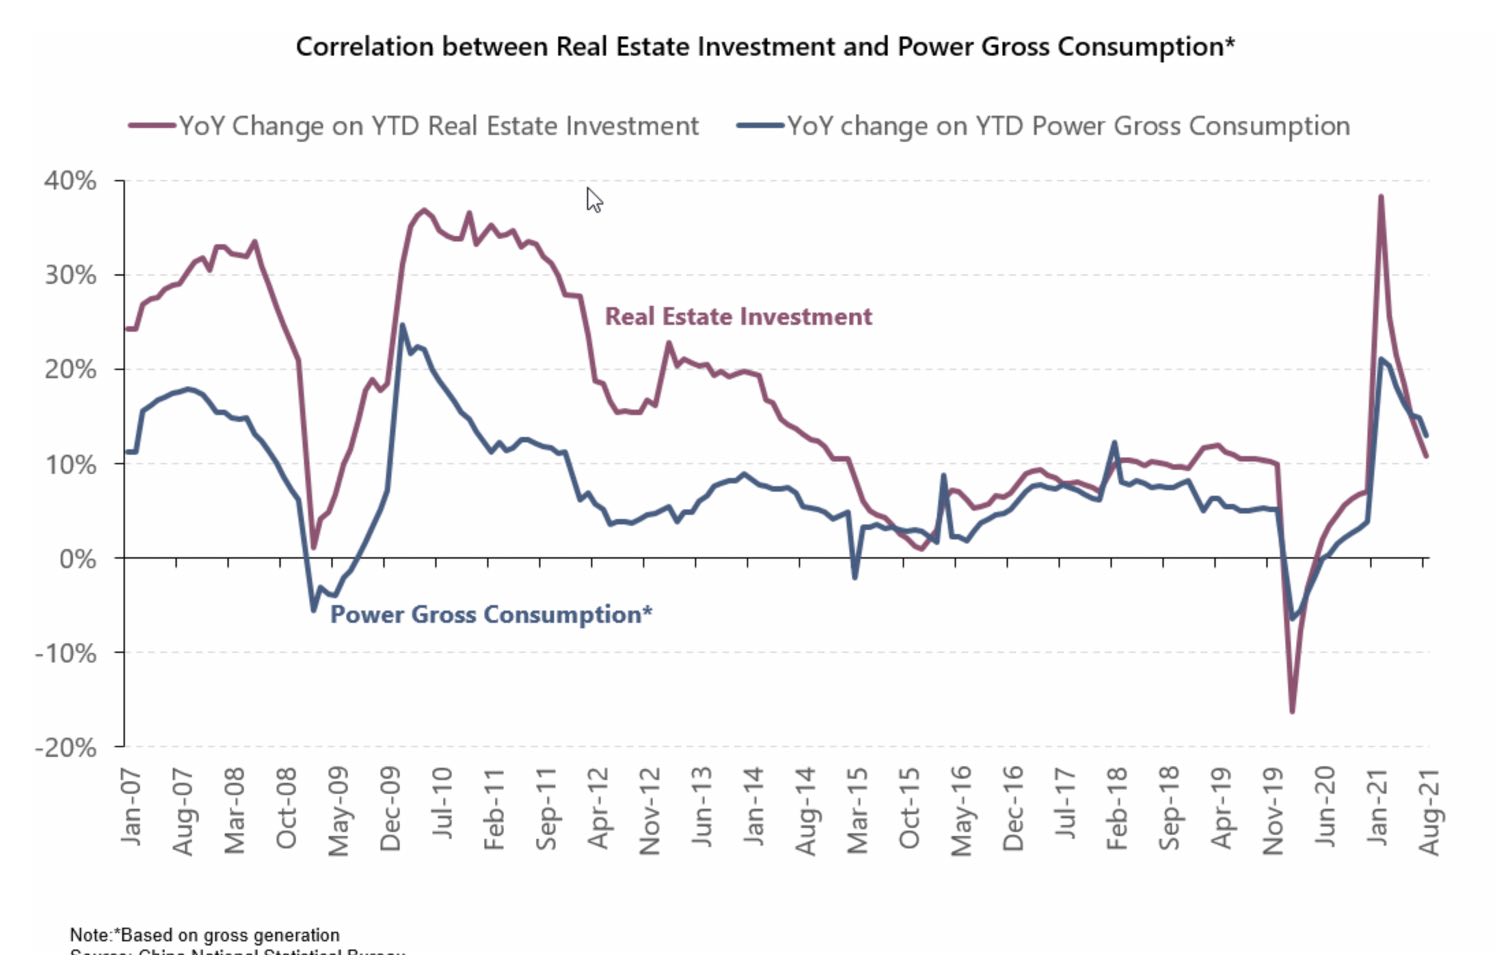
This relationship holds even though residential use of electricity in China is quite small as a share of total.
However, that’s not my point. What I’d observe is that real estate investment has been growing at around 8% compound from about 2015, although it is hard to really tell.
Cement consumption though has never exceeded its 2014 peak. Either the Chinese construction economy is becoming less cement intensive, and/or prices are rising, so investment per unit of output is going up. But one way or another the real world construction isn’t showing the same growth as the financial stats.
So again, the negative conclusion is that China’s housing investment will decline and some new growth engine will be required. The top of the physical cycle passed years ago if we use cement as the measure, but is yet to show the 20-30% declines that would be typical of cement cycles elsewhere in the world. The financial decline isn’t evident at all in the official figures.
When the decline does happen, coal and steel demand will be impacted. This is a good thing for carbon emissions but may not be great for Australia’s economy if we aren’t prepared.