“Nature does not hurry, yet everything is accomplished” Lao Tzu
Perhaps because of the need to make leadership look good in front of the five yearly leadership congress, China’s “deindustrialization, cleaner air, decarbonization efforts” have taken a step backwards in 2017.
The question is whether China is going back to the mad growth of 2006-2014 or whether the normal economic forces will reassert themselves and China’s growth will trend down and be focused more on services.
Additionally, there is a question about debt in China and whether a genuine slowdown in property development will reveal some cracks.
China is at the forefront of global efforts to reduce reliance on both coal and oil. As it must be.
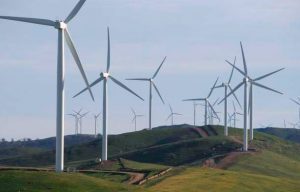
The solar industry’s global progress depends on the barely profitable, massively growing Chinese PV module producers. Wind turbine developers like Goldwind are at the forefront of driving down wind technology costs. Wind and PV in China have grown enormously.
And yet for all that coal has maintained its share of electricity generation this year; property development, as measured by cement consumption continues as strong as ever and steel and plastics have grown apace. China’s coal to gas growth has the potential to add 500 mt of CO2 a year, almost equal to another Australia.
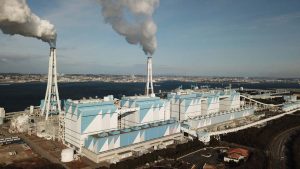
China’s smoke stack industries though are seeing profitability declines. Electricity depends on imported coal at the margin, which at A$100/t makes life tough. Measures to curb pollution on the Eastern Seaboard mean that cement, steel, some electricity producers have to close during Winter. We take a look at the background and the State of play.
Thermal generation revenue
Just a scene-setter on prices to start with.
We looked at Shenhua, H1 2017 financials. They reported generation revenue of 35886 m RMB on dispatched generation of 114.4 bn/KWh. We convert this to about A$61 MWh. Coal sales for Shenhua were 220 mt and coal revenue 75 bn RMB or A$65/t.
Inevitably China’s electricity intensity will decline
China’s electricity consumption per unit of GDP is one of the world’s highest. This reflects the Country’s role as global manufacturer of chemicals, plastics, steel and many manufactured goods.
In addition, the country’s enormous more than a decade long construction boom has resulted in huge, huge, increases in production and consumption of cement.
A byproduct of these policies has been to make China by far the largest CO2 emitter in the world. However a more immediate problem for the Govt has been public unrest at the smog caused by SOX and NOX emissions.
One perspective on China can be seen from cement stats, not something normally showing up on Reneweconomy.

This figure shows that China now consumes each year more cement than the whole world including China consumed just 10 years ago. China’s cement consumption is about 10X the number 2 country in world India, and about 25X the USA. Think about those numbers.
Most of that cement goes into building construction. Some into roads etc, but the vast, vast majority into building. In the building industry the global metric for when a country is fully developed from a cement perspective is when cumulative consumption is about 20 Kt per person.
If you take 2000 as a starting point China will exceed that this year.. Every building boom eventually ends. Every building boom.
Still, the point is that building construction has been a major driver of demand for aluminium, demand for steel demand for energy to power the buildings etc. Cement demand peaked in 2014 it just hasn’t yet started falling the way we think it will.
The declining rate of heavy industry growth in China can be seen by looking at the Fixed Asset Investment [FAI] growth rate

This is a positive for slowing the growth in electricity consumption. China has relatively high electricity intensity (consumption per unit of GDP) along with India and Russia but still an overall relatively low consumption per capita. As GDP grows we expect China to move to the upper left hand side of the figure below.
In the end though it’s the size of the bubble (China’s 5.2 PWh of electricity consumption) and the fact that most of that electricity comes from coal which is the big deal.

One final contextual figure shows that coal consumed for Electricity production in China is about half total coal consumption.

After seeming to hit a peak in 2015 heavy industry and emissions have started growing again in 2017
In 2017 coal consumption in China is just fractionally up on last year for 8 months ended August 2017
In China electricity consumption for the 8 months ended August 2017 is up 6.8% with electricity used in secondary industry (70% of total consumption) up 4%.

Electricity consumption by fuel in China, coal has held share this year despite wind and PV growth
Turning to China’s generation by fuel we see a drop off in Hydro which has largely been taken by wind. The other feature is that coal fired electricity generation is up with unchanged market share on last year, but average utilization hours remain below 50%.
We see this as still a difficult profitability outlook for China’s coal fired electricity sector given the exposure to imported coal. If electricity tariffs are set based on average coal costs but some producers have to buy imports they will be squeezed.
Wind hours grew in 2017
An encouraging feature of the data was the 8% increase year on year in average utilization of wind farms. This indicates some of their access to transmission issues are gradually being overcome.

If we turn to capacity additions what we see is that despite the fantastic and huge increase in PV capacity, the higher capacity factor of coal means that we expect it to contribute about 43% of the new generation output. At this rate we will see only a very slow decline in coal’s total share of electricity production in China.

China’s CO2 emissions in context
The growth in China’s housing and in its manufacturing and in its coal fired electricity has lead to China having almost double the USA and 3X Europe CO2 emissions.

As figure 5 shows its not just coal but also the growth in Oil, gas and cement that have contributed. Still gas and cement together are only 60% of coal. And that is why we get the focus on renewable electricity and electric vehicles charged by renewable electricity.

Putting the two graphs together it will be no surprise its coal emissions in China that are the single biggest thing in global CO2 emissions
This was well put together in a March guest post at CarbonBrief

David Leitch is principal of ITK. He was formerly a Utility Analyst for leading investment banks over the past 30 years. The views expressed are his own. Please note our new section, Energy Markets, which will include analysis from Leitch on the energy markets and broader energy issues. And also note our live generation widget, and the APVI solar contribution.
Here the discussion on the latest Energy Insiders podcast with China-based Greenpeace analyst Lauri Myllyvirta.