Latest Chart of the day
“Truly mind-blowing:” Scientists fear strongest El Nino will push climate into unchartered waters
Climate scientists are astonished by the scale and speed of the developing El Nino. “We are both figuratively and literally in uncharted waters.”Graph of the Day: Half-time and hydration breaks lift grid demand in England and Norway World Cup game
England and Norway experienced big surges in demand during half time and hydration breaks in World Cup game, and smaller ones when goals were scored.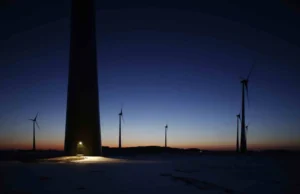
Renewables covered record 58 pct of German electricity consumption in first half of 2026
Renewable energy covered a record 58 pct of Germany’s electricity consumption from January to June 2026, despite an 8 pct fall in hydro output due to low rainfall.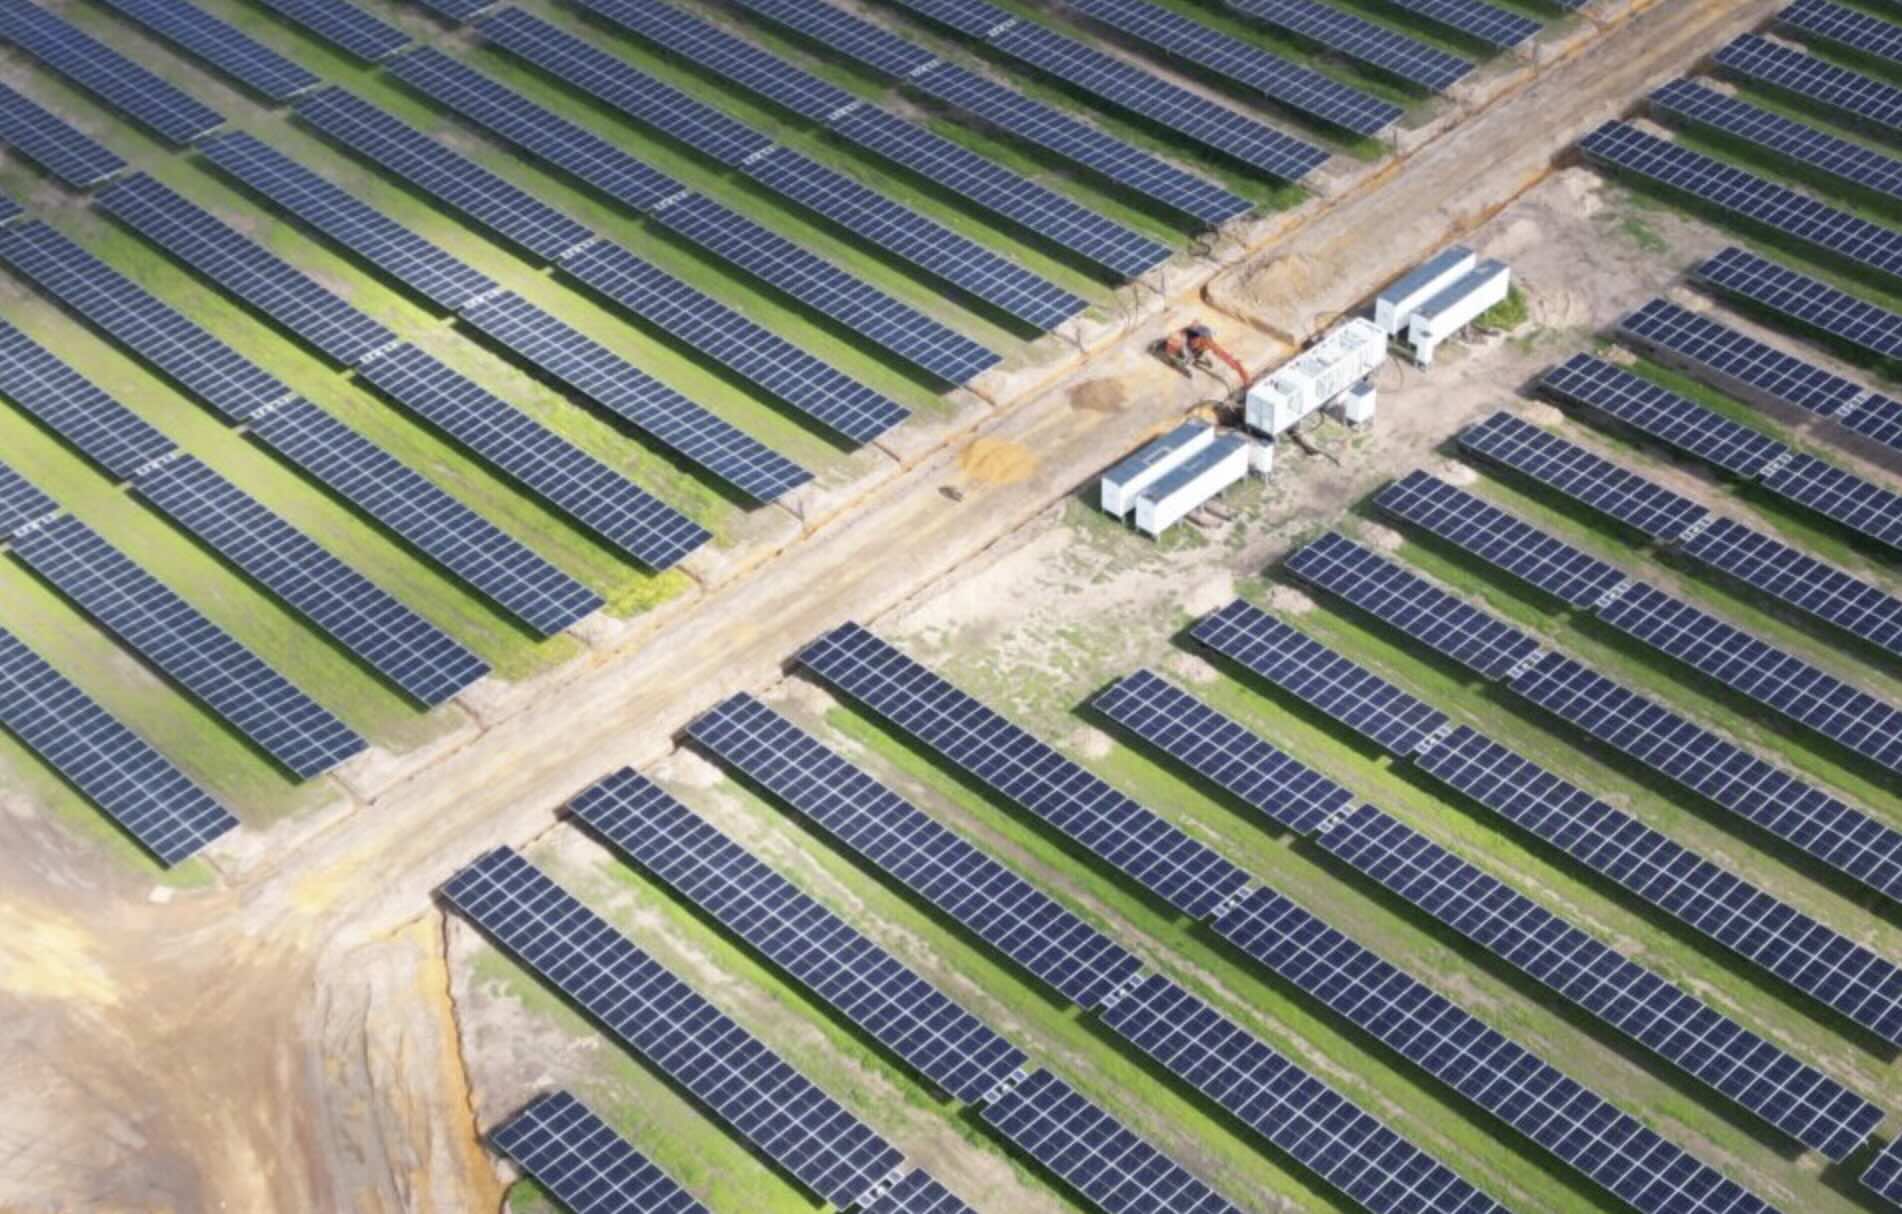

All Chart of the day

“Truly mind-blowing:” Scientists fear strongest El Nino will push climate into unchartered waters
Climate scientists are astonished by the scale and speed of the developing El Nino. “We are both figuratively and literally in uncharted waters.”
Graph of the Day: Half-time and hydration breaks lift grid demand in England and Norway World Cup game
England and Norway experienced big surges in demand during half time and hydration breaks in World Cup game, and smaller ones when goals were scored.Renewables covered record 58 pct of German electricity consumption in first half of 2026
Renewable energy covered a record 58 pct of Germany’s electricity consumption from January to June 2026, despite an 8 pct fall in hydro output due to low rainfall.
Chart of the Day: Farewell King Coal, long live King Solar (and wind and batteries)
In capacity-addition terms, fossil fuels are now just a thin orange strip at the bottom of a very tall green wall.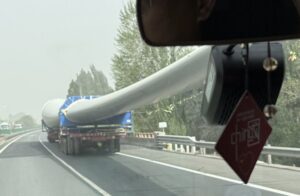
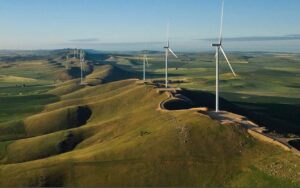
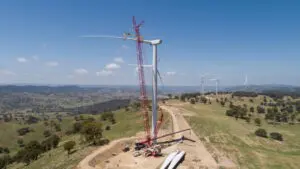
Photo of the Day: Australia should allow wind turbine blades to be trucked in convoy
Updated: In China, they deliver wind turbine blades in convoy to project sites. It must be much lower cost than in Australia, where blades are moved piece by piece, with police escorts.
New records for wind and battery output in last month of autumn, taking big bite out of coal and gas
A big increase in wind output and new records for big batteries helped push coal and gas generation down in the last month of autumn.