This note serves to make two points: More batteries equals more pain for coal and gas generators, and wind is also contributing to the moderation in evening peak prices.
We are about half way, maybe 55 per cent, through the utility and home battery surge and its impact on evening prices.
There is a lot more to come even if no more utility batteries were to get to FID (financial close). The pain to gas and coal from more batteries is going to Intensify. Coal generators will come to need Government support but they still can’t close until more wind is built.
In 2026, 1 gigawatt (GW) of extra wind, 1 GW of utility batteries and 1 GW of peak period behind the meter production have combined to virtually halve evening peak prices, cutting gas and coal output by 2 GW.
Wind and utility batteries are each providing an extra 1 GW in the evening this year compared to last year. Arguably, though, the kicker has been home batteries which I estimate are also cutting evening peak operational demand by maybe 0.8-1.0 GW.
The net effect of lower prices, more battery output at evening peak and more wind has been to drive the spot revenue of the two largest coal generators in each of NSW and Queensland down about 30-40% from last year. I use 90 days to capture more of the battery surge.
For one reason or another 3 of the 4 coal generators in this group have lower capacity factors this year than last. The lower capacity factors didn’t help prices. Spot prices are still way down. So price is down, volume is down. Pain is up.
Lots of people will tell you spot revenues don’t matter, what matters is PPA (power purchase agreements) and other portfolio impacts.
But in the end I’m here to tell you that the spot market drives the hedging market. No-one is going to hedge at $100 a megawatt hour if the spot market is always at $50. So you have to decide is the signal from the spot market genuine or noise.

Figure 1: Cumulative spot-revenue buildup, 90-day average day, for the largest coal stations in NSW and Queensland, this year vs last. Source: AEMO (SCADA × RRP), ITK
I don’t want to talk about how dumb Queensland strategy looks to me more than I have to. But look at the Stanwell capacity factor. Look at the Gladstone capacity factor.
Queensland has too many coal stations rather than too few. Gas generation is getting absolutely slaughtered right now. So what does Queensland do? Build another gas power station.
But the broader point is that a lot more wind is needed. Wind is just as important for managing prices as batteries. More batteries will kill coal profits but more wind can replace the job coal does.
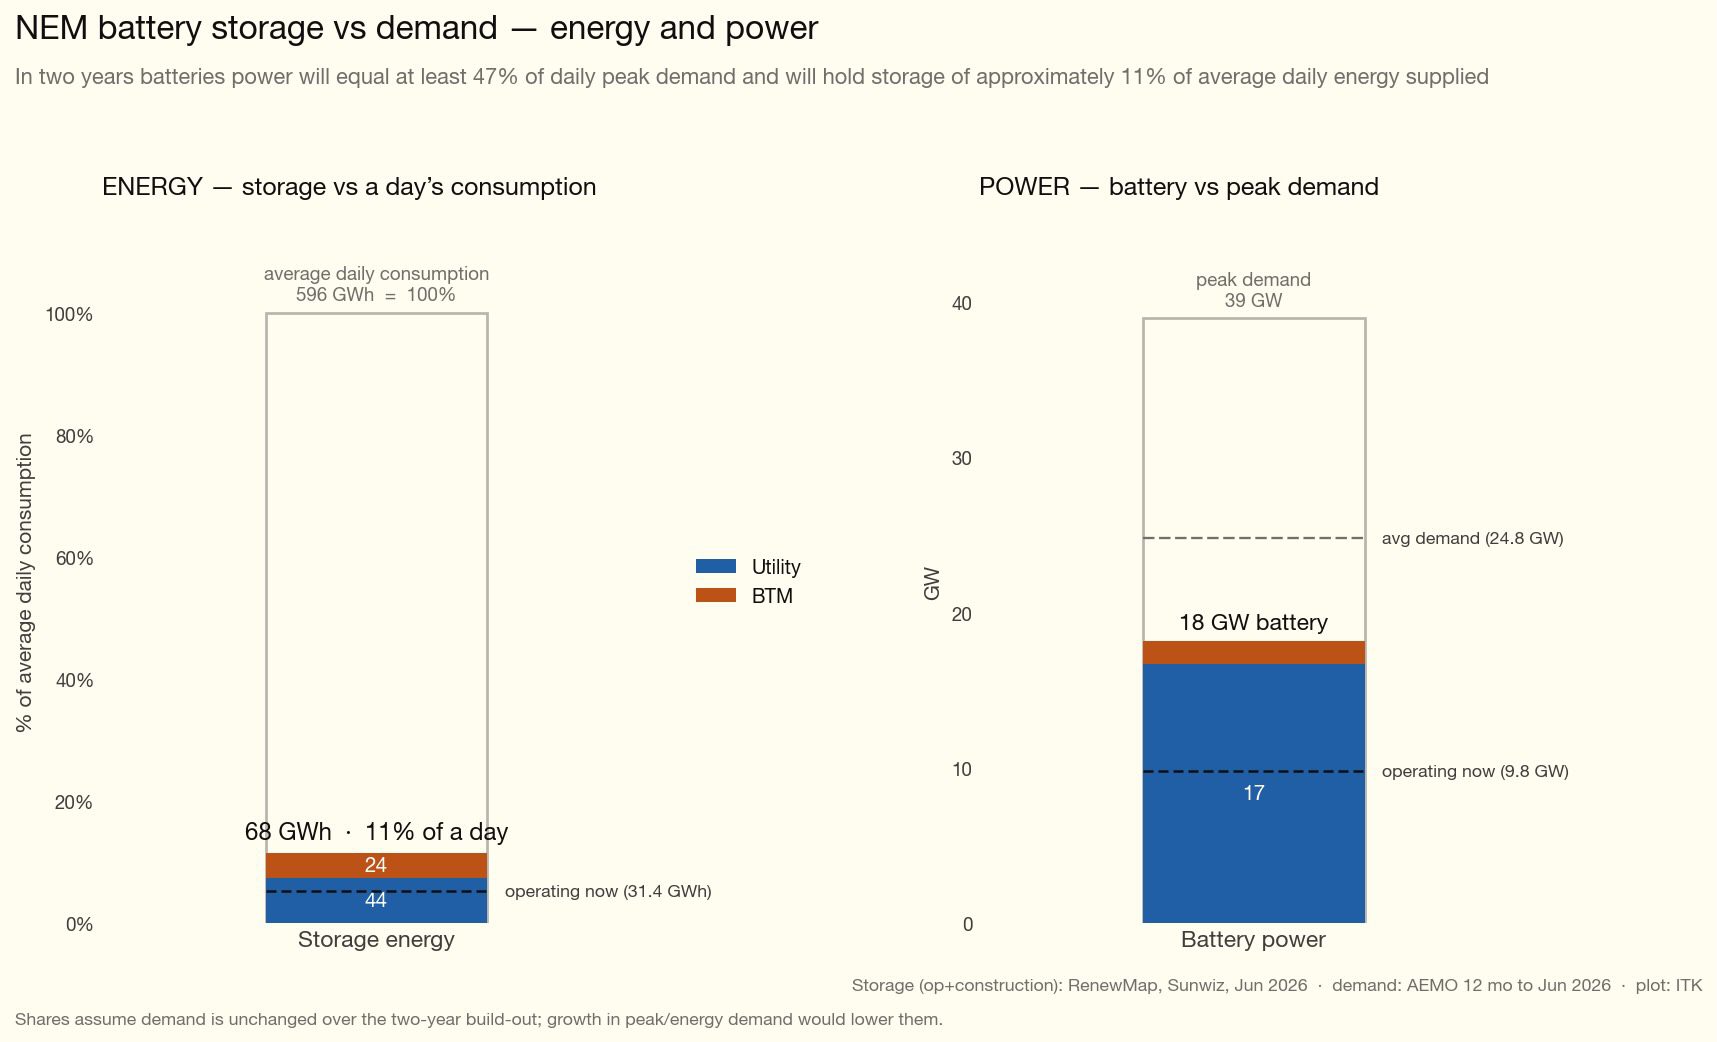
Batteries already cover about 11% of a day’s energy and about 47% of peak power
As regular readers will know the impact that batteries are having on evening peak prices is no surprise to me, nor I suspect to other careful analysts.
It’s long been obvious that once built, batteries’ marginal cost is lower than gas. That is because batteries charge from midday solar at “low” prices certainly way lower than the say $100/MWh or more that open cycle gas has to pay.
We have known for at least five years that all that had to happen was for batteries to get built, and for the ownership to be spread around a bit so that they compete and that then peak prices would fall.
Pre battery peaking fuels included hydro as well as gas. This is where Paul Broad gave Snowy a self inflicted Irish six pack. When Broad and the Snowy Board gave FID to Snowy 2 they effectively threw away Snowy’s long held dominance of the NSW/Victorian peaking market.
Snowy was stuck with the biggest white elephant in the history of the NEM and thanks to poor focus and no money little to no ability to compete in the battery market.
In Australia any plans the other “big boys” had of taking over from Broad’s colossal misjudgement were then thrown out the window by Chris Bowen’s home battery subsidy.
Direct visibility of the impact is limited but we can make some estimates. As of today there are say 420,000 home batteries more than a year ago, representing perhaps 11 GWh of supply. As an aside to charge those batteries you probably need around 3 GW of rooftop solar, only about 18 months’ worth of new supply.
Anyhow if you look at household load profiles published by the likes of Ausgrid, average evening peak demand is around 1.3 kW, but in Winter and assuming battery equipped residences tend to consume above average I think 2.0 kW is a defensible number.
And so, in the past year, home batteries likely shave maybe about 0.9 GW of evening peak demand. The numbers are changing quickly, so any backward looking average will tend to understate the “instantaneous” and forward impact.
In that context let’s look at the following plot, which I added to my dashboard earlier this year since it’s a key metric for investors going forward.
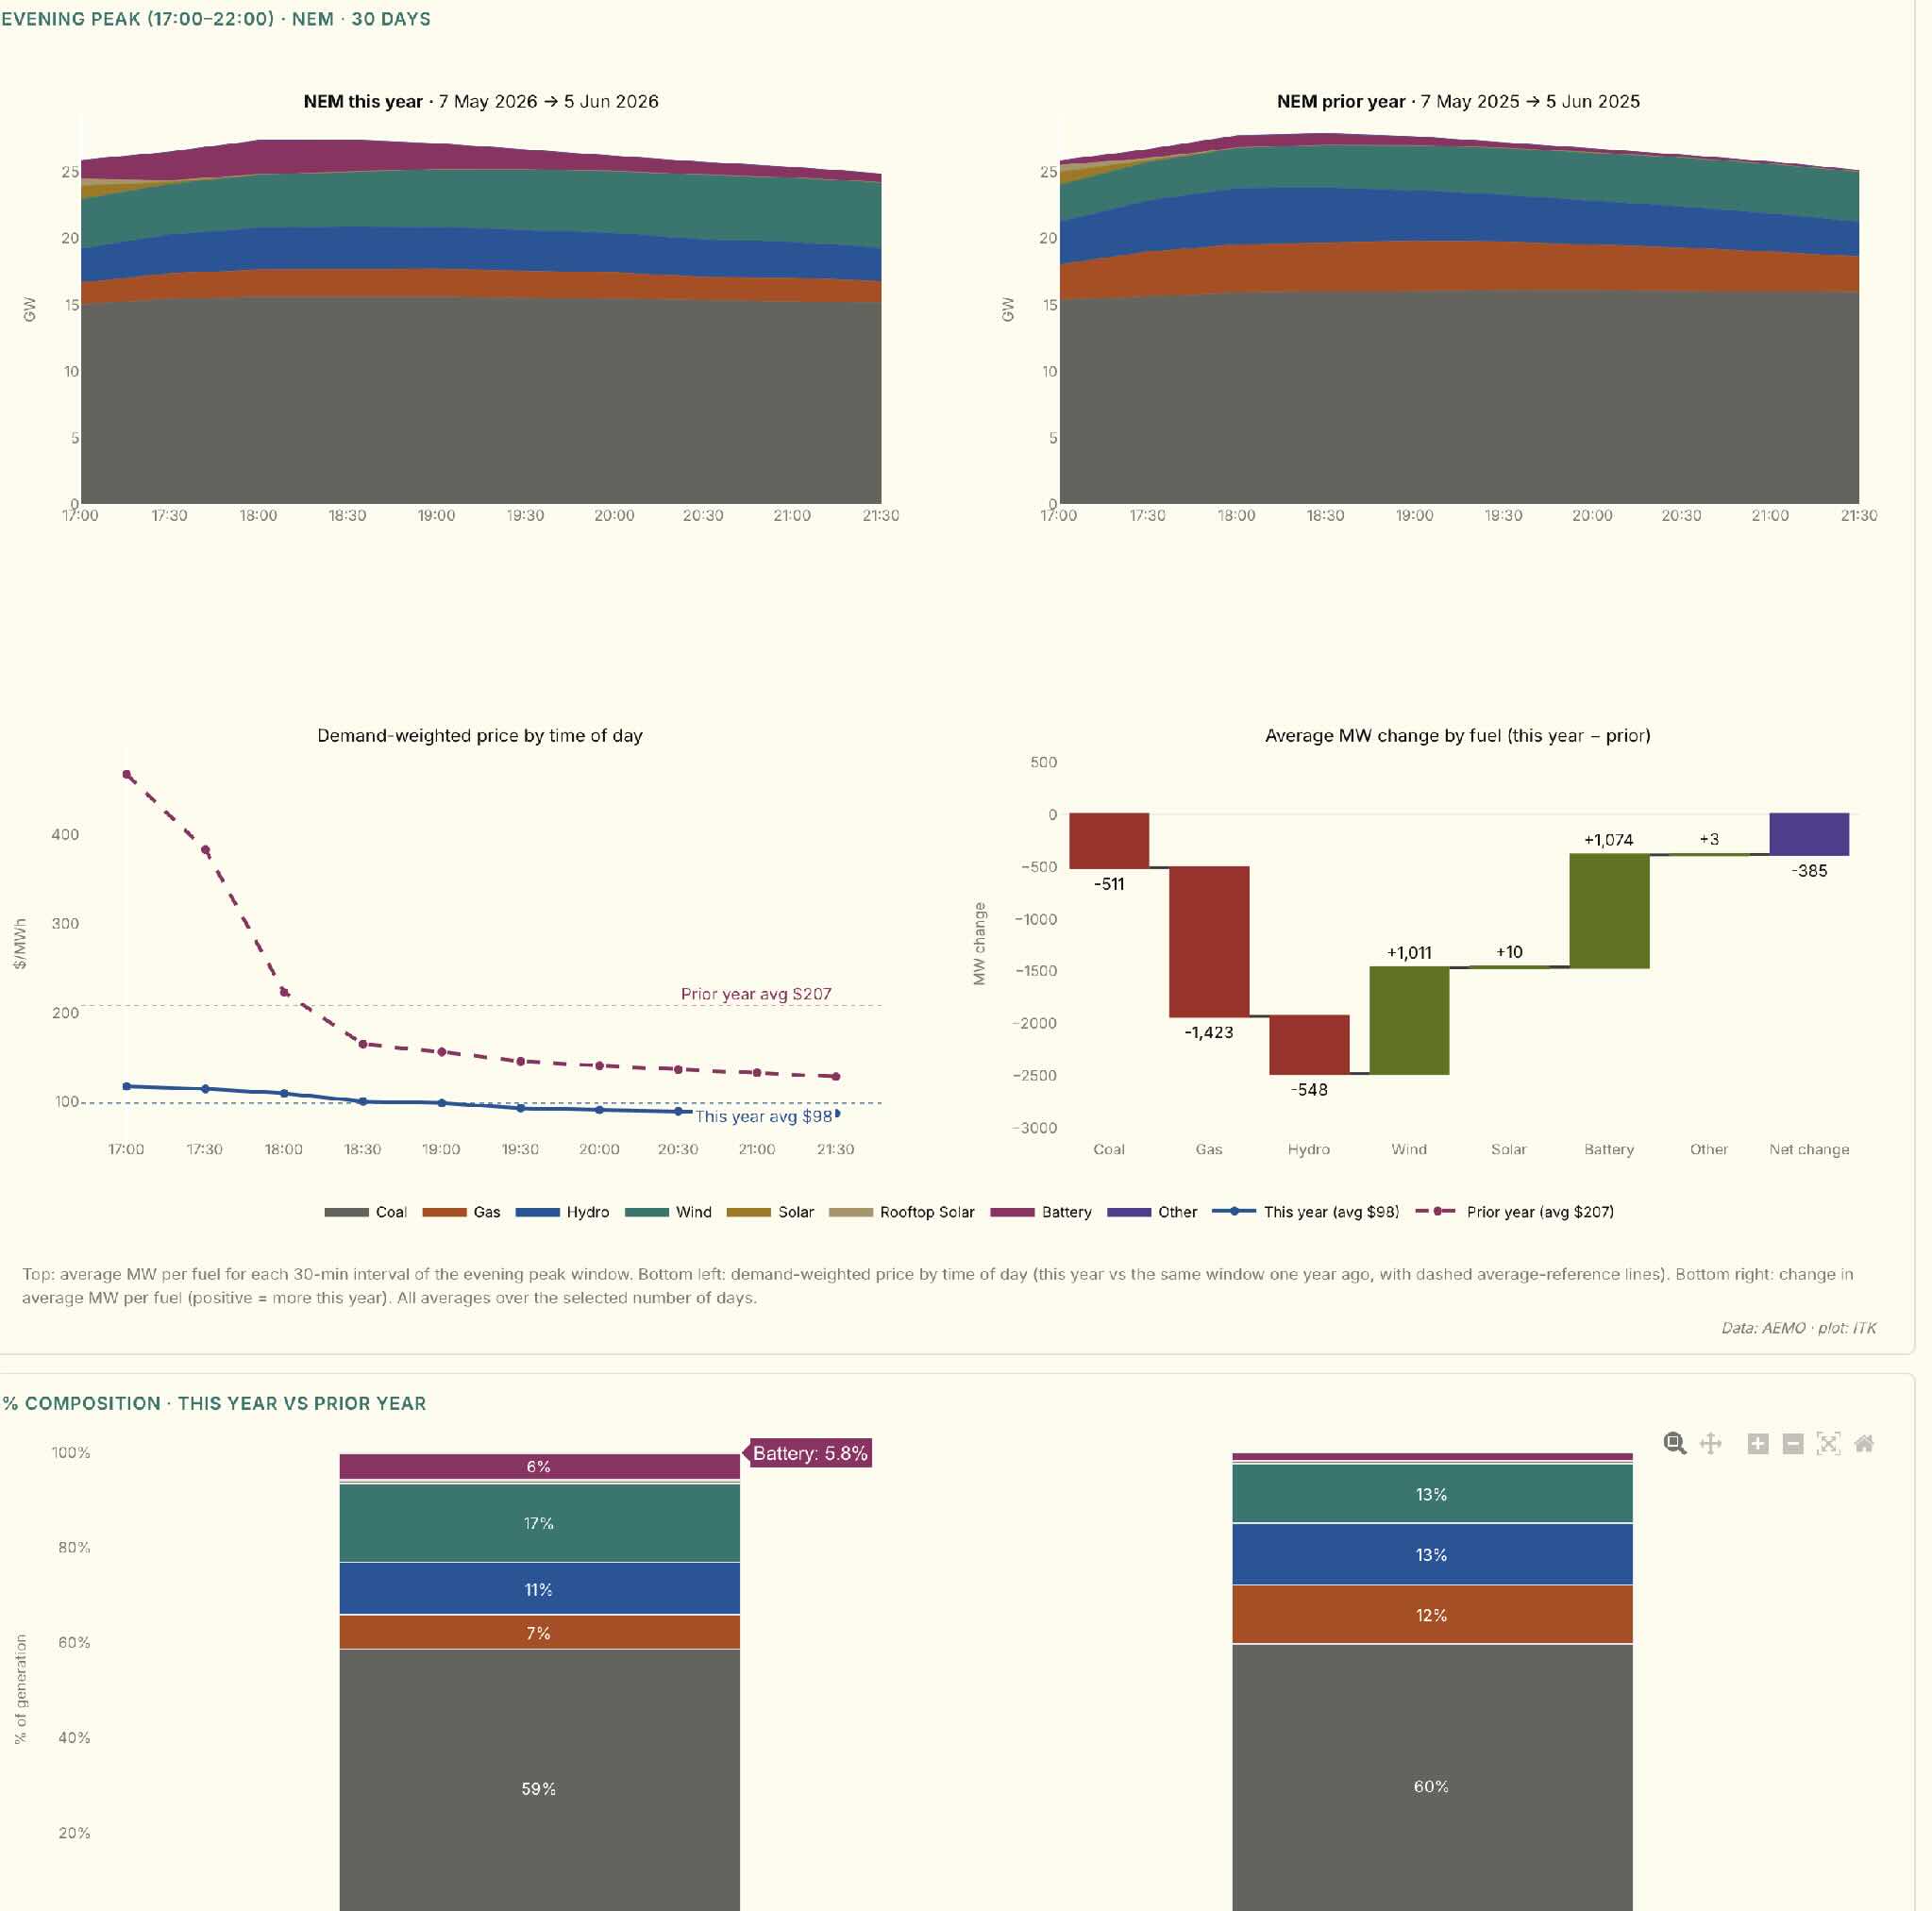
Figure 3: NEM evening peak supply by fuel, 30-day average, this year vs last year. Source: AEMO, ITK
On a 30 day basis across the NEM, utility batteries made up 5.8% of evening peak supply — on average about 1.1 GW more than last year across the 5–10 PM slot.
Total peak OPERATIONAL supply is down close to 400 MW and one interpretation is the decline is due to home batteries. If I compare average total demand (operational + rooftop) using 24 hour data rather than just peak then the total is up 400 MW or 1.6%.
Peak time operational demand is down 400 MW and total 24 hour demand is up 400 MW so the data is consistent with a view that home batteries are reducing peak demand by about 800 MW, 400 visible and 400 invisible.
But it’s WORSE than that for coal and gas and hydro because in fact as the plot shows between new wind farms in Victoria and Queensland and probably better wind conditions wind generation in peak time is up 1 GW.
Coal supply is down 500 MW, Hydro supply is down 550 MW and gas supply is down 1400 MW. That lower supply in the evening peak has been replace by batteries and an additional 1000 MW of wind.
Lots more to come yet – battery total will get to 68 GWh!
I have to say it’s taken me a while to get up to speed on the implications of the home battery thing. According to Sunwiz’s latest data as published at RenewEconomy 1.5 GWh was installed in May, a material decline from April .
Monthly installations may drop further, May was the first month under the reduced rebate but an ongoing installation rate for another 6 months of say 1 GWh/month would not seem a very brave forecast.
That’s still 7 GWh more by the end of the year. And would take total behind the meter storage added under the scheme to say 18 GWh. And that’s in just 18 months. There’s a lesson in there about how mass markets can move the dial very quickly.

Figure 4: Behind-the-meter battery installation rate. Source: Sunwiz via RenewEconomy, ITK
And on the utility side there is — count them — at least 40 GWh more in the pipeline, more than doubling what’s currently operating.
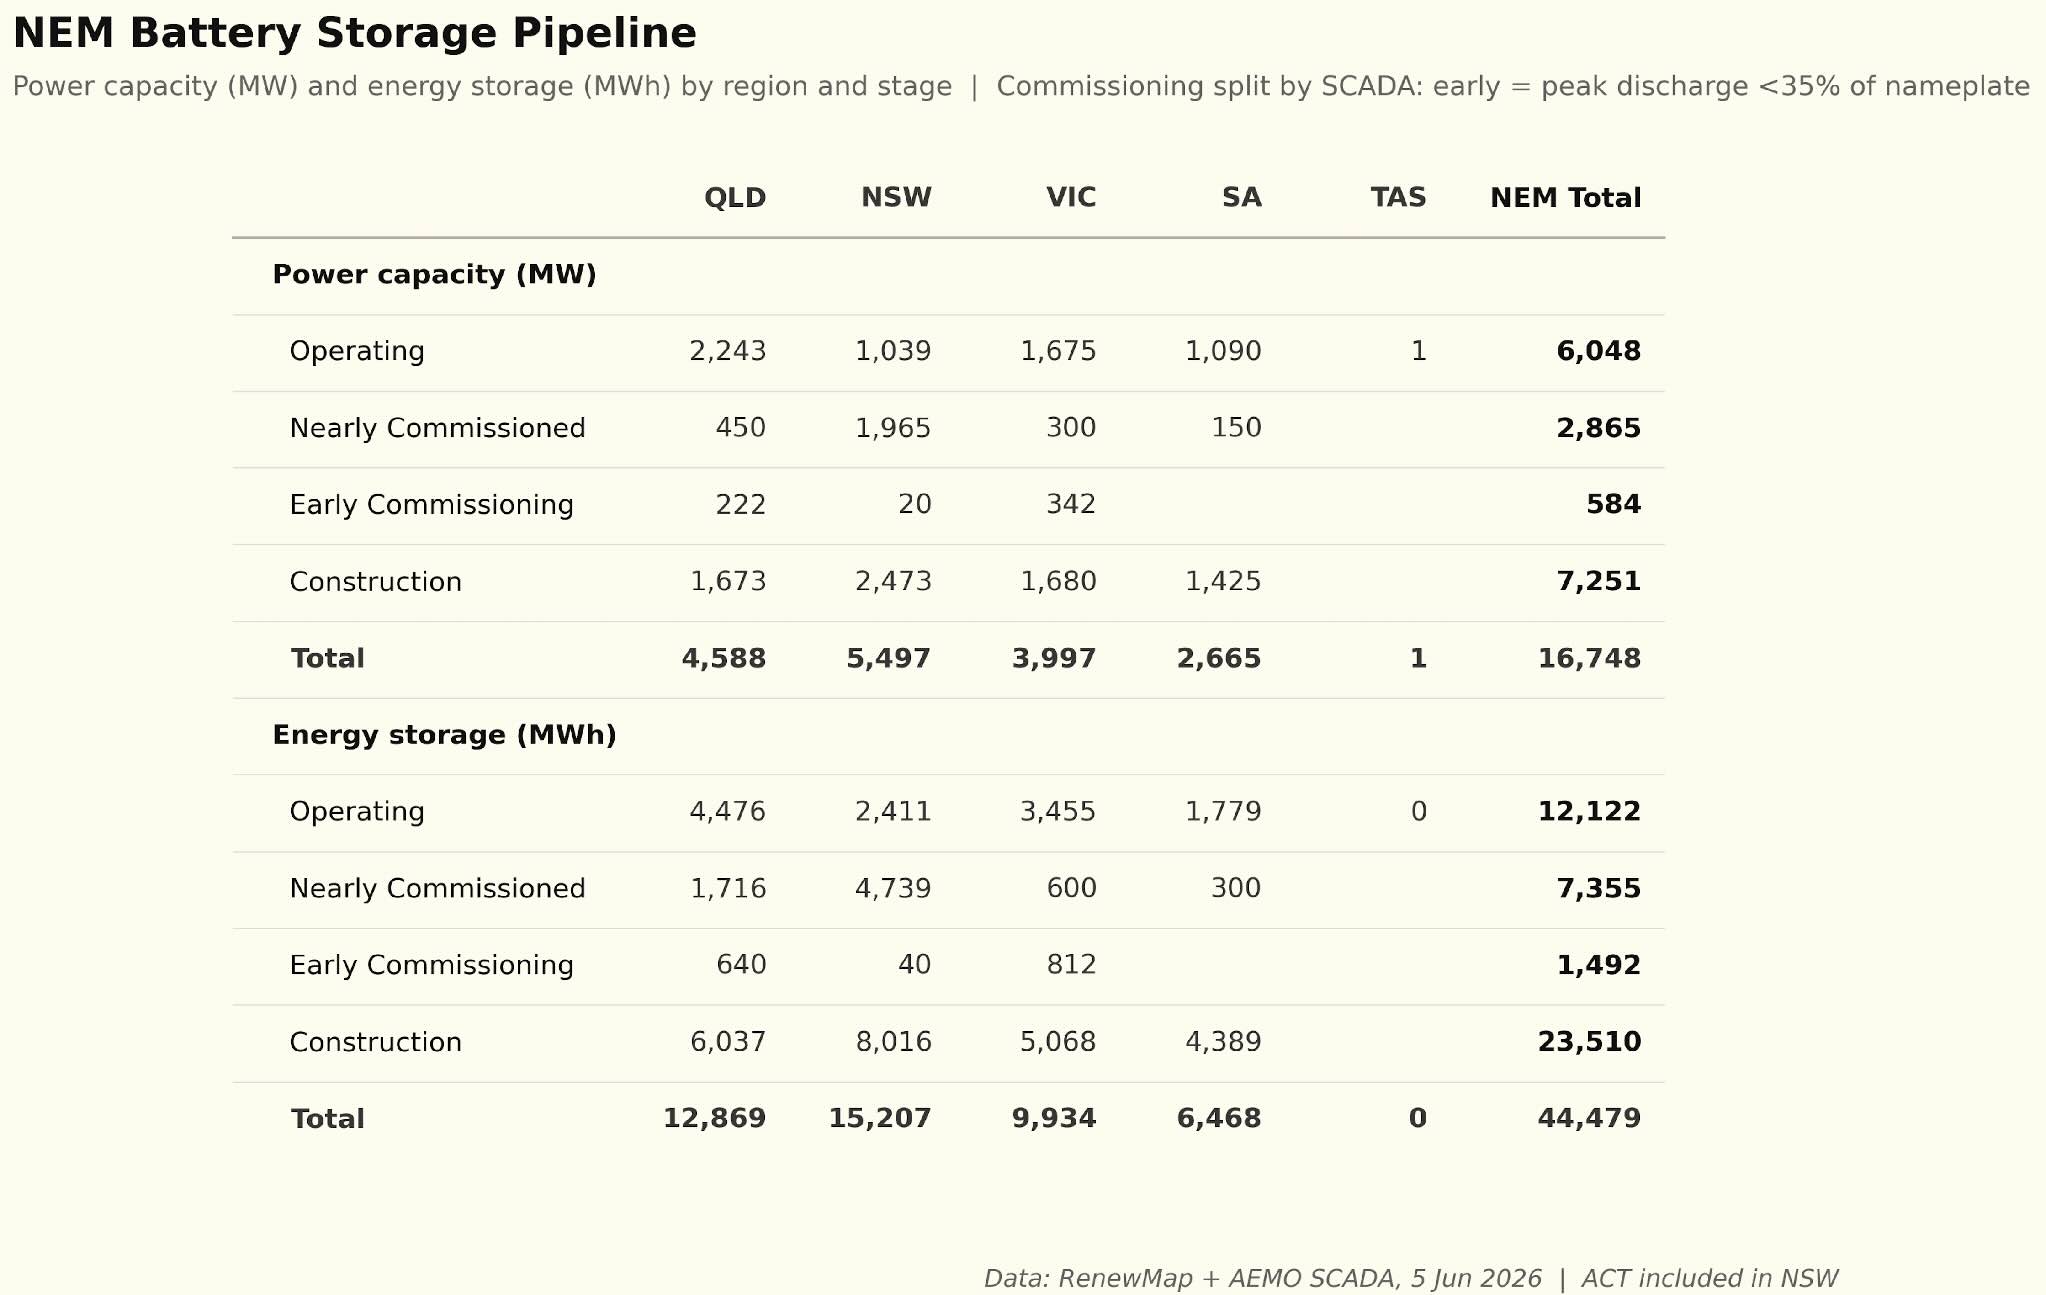
Figure 5: Utility-scale battery storage pipeline. Source: RenewMap, ITK
In total we can see that BTM is much more significant when it comes to duration than power. In saying that, residential inverters are capable of 5 kW rather than the 1.5 to 2.0 that I assume but I mostly just are used for the normal household pattern of demand.

Figure 6: Battery storage, operating vs under construction, split utility and behind-the-meter. Source: RenewMap, Sunwiz, ITK
Battery power is much bigger on paper than what has been observed in practice. Peak operation battery power is 3.58 GW on 13 May at 18:00.
However, if I add together the non coincident regional peaks then the total is 5 GW. The storage numbers though are quite close to what AEMO shows. Peak storage is about 16.2 GWh whereas my numbers show a theoretical 19.4 GWh of operating utility capacity, some of which to be fair is still commissioning.
You could argue my numbers on BTM (behind the meter) storage that will be added over the next two years are very conservative.
Out of interest here is my dashboard SOC gauge as at 21:30 on a Saturday night. I look at this gauge these days as much as any other. And in fact on Sunday a new NEM-wide SOC record of 16.3 GWh was set. But it won’t last long.
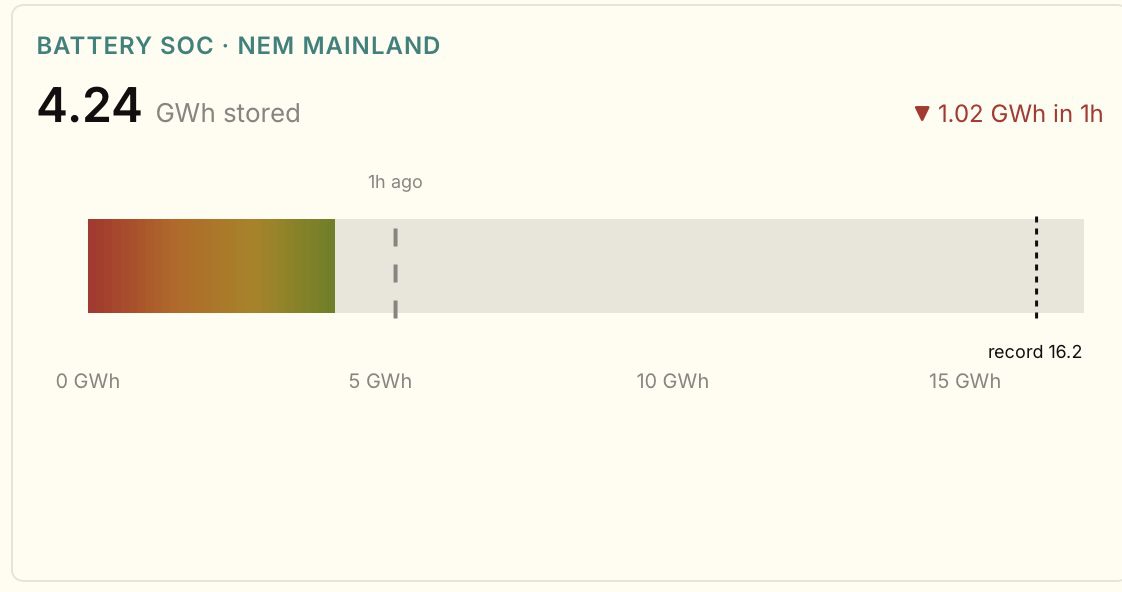
Figure 7: NEM battery state-of-charge gauge at 21:30 on a Saturday. Source: ITK dashboard / AEMO
Implications – enough new supply to cut all gas, hydro and 5 GW of coal
Right now, there’s about 24 GW of operational evening peak demand if I exclude the part already met by batteries.
One of the big uncertainties is demand growth. On the one hand population growth has slowed and on the other hand we have EVs and Data centres. Maybe underlying evening peak demand could be up 5% in three years’ time, or around 1 GW. Against that there will be substantial new battery supply.
You can eyeball Figure 3 above. At 6 PM there is about 3 GW of hydro and 2 GW of gas on average over the past 30 days, add in 1 GW of demand growth. New battery supply, never mind the new wind, is 9 GW.
It’s obvious that prices aren’t going to rise in that scenario but as I wrote months ago before the full horror was as visible as it is today, the likelihood is that coal volumes and revenues will also be impacted, or to put it another way will be further impacted.
To start with not all the gas is going away. Some in South Australia will continue to be required. Tasmania despite an unrelenting drought will keep consuming hydro. So I think 5 GW of coal generation is at risk.
Of course that neatly coincides with Gladstone, Yallourn and Eraring.
And the next point really is QLD. Let’s look at the Qld version of the evening peak.

Figure 8: Queensland evening peak supply by fuel, 30-day average, this year vs last year. Source: AEMO, ITK
The biggest fall is in coal generation and about half of that is due to lower exports to NSW. Those evening exports are quite valuable to QLD generators and I am guessing in another couple of years, even allowing for Gladstone closure, QLD coal generation volumes will remain under pressure.
I suspect that some Qld generators believe that once Eraring closes, if it ever does, then QLD generators will gain share and prices will pick up. The growth in batteries sits on the other side of that argument.
Origin Energy finally discovers wind costs have gone up – doh
About 1.6 GW of wind is under construction but that is nothing as to what is required. We need 50 GW of wind to fully decarbonise and only 13 GW is operating. So more than 35 GW remains to be financed and built over the next 15-20 years.
Origin Energy owns one of the larger projects Yanco Delta.

Figure 9: NSW wind projects under development. Source: ITK
Origin, having built nothing for years, and signed zero PPAs nevertheless committed $300 million to acquire the rights to develop Yanco Delta, despite the fact that its EIS was known to need to be resubmitted.
Origin then is said to be likely to appoint Bechtel to do electrical and civil work and Goldwind is expected to be the turbine supplier.
The Stockyard Hill model had the project sold pre development to Goldwind, at least I think it was, and Goldwind picked its own contractors.
The point is Bechtel has no experience of wind farm BOP in Australia, and not much onshore globally. Of course they are experienced electrical and civil work contractors.
It’s great that Frank Calabria at Origin can stand up at a conference and say his project for which he paid top dollar and which he has chosen an expensive contractor is facing cost pressures.
And much as we’d like to be back in 2016 or whenever it was that Origin actually last took any interest in wind development in fact we are in 2026 and things have changed.
And wind development is really hard work. And it’s the kind of work where, in my opinion, you have to do it continuously to build up skills and move down your own cost curve.
I think my point is Origin is going to be buying the output from its own project and still can’t even bring itself to do that. Let alone buy the output from anyone else’s project.
Yanco Delta experience is the outcome of short term thinking
Whether it’s wind or solar the large gentailers are off the pace. All of them have chosen the path of short term profits over longer term positioning. Origin could have been developing projects from the day after it sold a share of APLNG.
It’s talked about the closure of Eraring for years and done nothing to replace it. Now it seems to be finding out that you have to work hard to develop the required skills to get a reputation as an efficient, low cost developer. Like say Westwind, or Neoen, or Tag Energy.
The summary so far as wind goes is:
- – We need the wind to do the transition properly. Study after study shows the same thing and that’s despite battery costs having fallen and massive over capacity in the Chinese solar industry.
- – Civil costs are up but actually the biggest driver is the WACC has gone up thanks to inflation . Transformers are up 100%. Smart operators, such as Paul Simshauser got their transformer orders in early. Beat the rush, beat the price rise. You can do that when you are actually in the business instead of playing at being in the business. Origin could have avoided these cost rises if it had been faster off the mark. Rising costs are not news and hardly worth mentioning and ultimately so what. We still need the wind. Origin is selling the wind to itself anyway so why worry.
- – The wind development industry has been boom-bust. That is a terrible way to manage costs. In retrospect, and I plead guilty here, we’d have been better sticking with an REC or a mandated renewable percentage. It would have led to steadier development.
- – The way forward quite clearly is to have a committed program of wind development where 2-3 projects around the NEM are going ahead all the time. One set of people do the EISs, another works on the grid connections, another team is managing logistics. The same teams move from one project to the next. We standardise on a couple of turbine designs and get pricing that reflects multi-year orders. Long term financing structures are designed. Offtake PPAs for all developments are visible years in advance so that each development proceeds as the previous one finishes.
- – In the NEM there are two geographies where this could be done right now. One is Orana which would require a commitment to Spicers Creek, Liverpool Range and Valley of the Winds so that development can be sequenced and costs managed. The other is in the South West NSW where the transmission is basically already available but not one project is at FID. If Victoria could push on with the Western Renewables Link and VNI West, going for 750 kV as Texas is doing we could develop far more wind.