The Australian Energy Regulator has released its latest quarterly wholesale markets report, and while it doesn’t say much we don’t already know about prices and events, it does reveal its internal struggles to get its collective mind around the concept of variable wind and solar.
The latest June quarter report covers the dramatic events of the energy crisis, where a surge in the price of international fossil fuels – coal and gas in particular – swept through the Australian market, pushing prices to the market cap, forcing an administered pricing event, and finally an unprecedented suspension of the market.
The situation in Australia – virtually every market participant agrees – was made worse by the sheer scale of generator outages, particularly coal. As the AER report notes itself, up to nearly 8GW of coal and gas “baseload” capacity was missing in action at crucial times during the dramatic events in June.

What is surprising, however, is the weight that the AER chose to give on the issue of wind and solar output, and its apparent astonishment to discover that the output is variable. Equally surprising is its lousy grip on data.
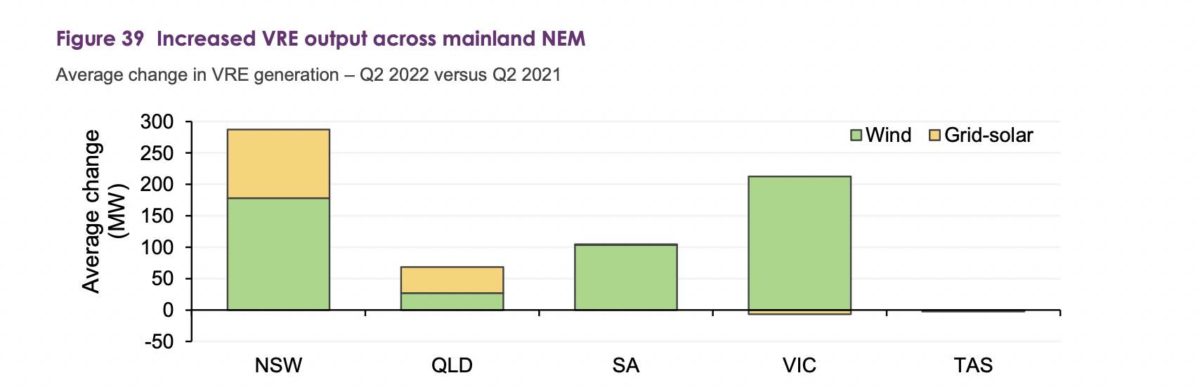
The AER points to the impact of large scale solar in Queensland – one of the states most affected by the soaring price of gas and the lack of reliability of its coal fleets – and of wind in South Australia, the state with the world’s highest share of variable renewables (64 per cent in the last 12 months) in a gigawatt scale grid.
But here’s the problem. It appears to have gotten the data in Queensland badly wrong. The AER cites the lower capacity factor of Queensland solar farms as a significant factor in the supply and price issues.

“Figure 3.9 clearly illustrates that on average, there was less solar electricity generated per MW of capacity in 2022 than 2021,” the AER report says.
“This pattern is consistent with impacts in other regions. This not only impacts large scale solar generation but also rooftop solar generation (effectively increasing demand).
“This resulted in other generators needing to operate at higher levels than anticipated to meet demand.”
The graph above does look bad. So, exactly what sort of quantum of supply shortfall are we talking about here? The AER doesn’t say, but for context it should be noted that the maximum solar output in Queensland from its utility scale solar farms at the time was around 1,600MW.
So, assuming the AER data is right, the most it is suggesting that could have been lost with the lower capacity factor is around 150MW of solar capacity, a tiny fraction of the coal and gas capacity that went AWOL at the same time.
But here’s the thing: It looks like the AER solar data is very wrong.
For a start, it claims that 1,000MW of new solar capacity has been added to the Queensland grid over the last 12 months, which would be a 50 per cent increase in one year. It didn’t happen.
We checked with leading renewables analyst Rystad Energy, which follows the data closely, and its number is much different. In total, it says, 800MW was added, but it’s important to note that that figure reflects the nominal capacity of those solar plants once they are finished, not what has actually been built so far.
Three of those solar farms, Western Downs, BlueGrass and Woolooga, had been connected to the grid, but they were not and still are not producing anywhere near their rated capacity, because they haven’t been completed yet.
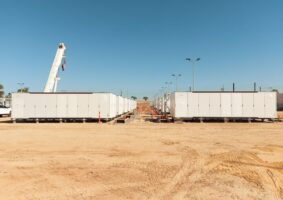
In the case of Western Downs, (pictured at top) which will be the country’s biggest solar farm when finished at 400MW, it has only recently reached a commissioned capacity of 100MW. Some of its modules have not been installed.
It appears that this confusion, between rated capacity when complete, and capacity available during construction, would explain the AER’s capacity factor assessments.
The AER appears to be counting the 400MW of Western Downs as the rated capacity and using that to tell us that Queensland solar farms produced less than was expected.
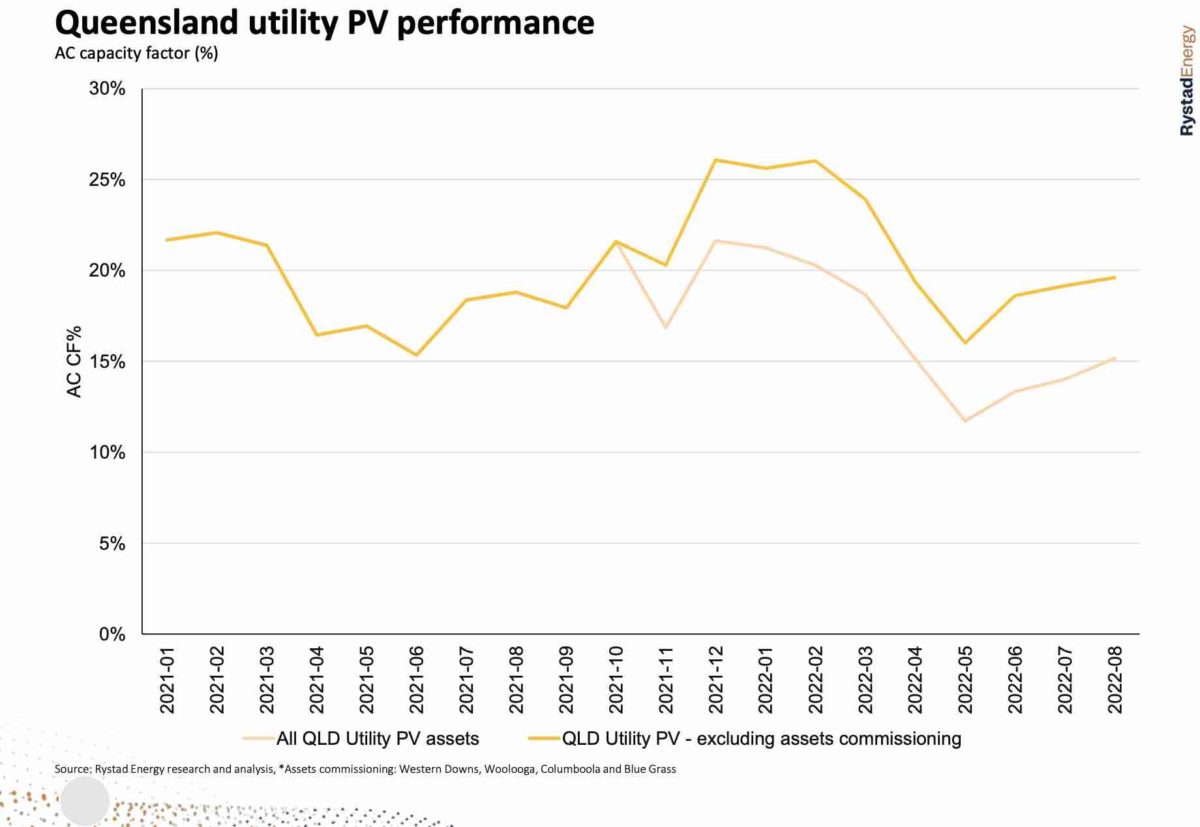
Rystad Energy have produced a chart (above) of the Queensland solar capacity factors showing the difference between the total capacity of those new projects assuming they were all complete (the bottom line which fits in with the AER view), and the capacity factor based on how much was actually built and commissioned at the time.
It shows that the capacity factor of solar farms in Queensland in the June quarter, in fact the whole of 2022 – based on what has actually been built – has been higher in 2022 than 2021, not lower as claimed by the regulator.
As for “less generation than anticipated”, it’s true to say that there is a fair bit of “hopium” about the renewables industry, but I’m not sure how many people – apart from maybe the AER – were reasonably expecting modules that hadn’t actually been connected to the grid to be supplying power.
And, just for the record, this is what the Australian Energy Market Operator said about average solar output in the June quarter in the two biggest solar markets, Queensland and NSW. They both went up. (See graph above).
The regulator really has to be doing better than this.
The AER also makes the same mistake when discussing South Australia wind. It lamented that:
“While wind output levels vary markedly from week to week, average output from wind in SA was down for two-thirds of the weeks of the quarter. Wind levels were particularly low in the week leading up to market suspension. In weeks where wind is low, other generators need to operate at higher levels to meet demand.”
Yes, wind is variable. Most people know that. But as AEMO reported in its own assessment of the same quarter:
“NEM-wide available capacity factor for wind generation in June 2022 averaged 40%, well above the 3-year June average of 33% (Figure 41).”

According to the AEMO data, the output of wind generation in South Australia was significantly higher in each month of the June quarter in comparison to the same month a year earlier: 635GWh vs 433GWh in April; 674GWh vs 612GWh in May; and 785GWh vs 738GWh in June.
Note the AEMO use of the criteria of “available” capacity factor, not stuff which hasn’t been built or connected yet.
As you can see from the AEMO graph above, there was a slight reduction in capacity factor in South Australia from last year’s record levels, and big increases in capacity factors in all the other states that make up the main grid. Strange that the AER did not choose to focus on that.
So it appears that the AER has decided to highlight two sets of data that – even if true – would have accounted for only a minor impact on the grid. And then it completely misrepresented them.
Why does this matter? Because if you can’t trust the regulator’s data to be accurate and presented in good faith, then really what’s the point. The AER has significant sway over political and media thinking of the operations of the grid.
Take, for instance, its decision to take the owners of the Hornsdale big battery to court over an incident after the Callide C coal explosion last May, which sent huge tremors through the grid and cut off power for thousands.
Neoen and the battery supplier Tesla had fessed up and said that while the battery had played the role expected of it in ensuring the grid held together, a software error meant it did not discharge as many megawatts as it had been paid to do.
There was no need for that extra capacity in the moment of crisis, and no one noticed its absence, but Tesla and Neoen came clean and returned the money.
Not good enough, said the AER, and it pursued the pair in court in the way an angry shop owner might take legal action against a customer who suddenly realised they had taken three packets of biscuits rather than the two they had paid for, and had even returned the excess (uneaten packet) when they realised their mistake.
Now the battery is being portrayed in the media, and particularly the ABC, as having “failed” to supply the necessary service to protect the integrity of the grid, which is actually not true.
The AER has a pivotal role to play in Australia’s electricity market, and the green energy transition that we are in the midst of.
If it really wants to make examples of wind, solar and battery storage, it really needs to take its role seriously, and get its data right, and in the right context. Otherwise, it simply can’t be trusted by others.
Note: We asked the AER for an explanation about their data calculations. They said they would get back to us.