Markets historically overshoot and anyone that tells you that “things can’t get any worse” just hasn’t been there.
The sport at the moment is working out the losers. In equity markets it used to be called “confession season.” Today, we have seen Origin Energy confess. Origin is the first victim of not working hard enough to replace its coal supply with renewables.
Year after year us analysts bang on about the need to build new supply before you close the old stuff. Year after year the industry pushes back that “returns aren’t high enough.”
And then then a profit torpedo hits. Guess what, low and steady returns and having operating capacity looks pretty good right now. If your battery is working you will get a bonus. But enough proselytising and, indeed, ITK’s own price forecasts look pretty stupid right now.
Whenever prices get way out of line, either buyers or sellers go short. That is they only will contract their immediate requirements, they wait for prices to correct and then lock in stuff as hard as they can.
So the immediate impact of things is uncertainty, buyers will not contract more than the minimum and traders will tend to shut up shop and go skiing.
The first window for price relief comes with Spring when demand drops and solar supply picks up. Eventually global coal prices will soften a bit as Indian summer demand passes and China’s new supply has an impact.
Europe, which is no doubt frantically restocking gas storage by taking gas originally destined for Asia, will see storage levels move to levels which will allow them to slow down their buying.
But overall the pressure will stay on and, in Australia, as for the world, it’s a case of building wind, solar, batteries, pumped hydro and the required transmission and IT infrastructure, and a lot faster than we have so far done.
Australia currently boasts around 30% renewables, but it’s a long darn way to the ALP headline of 82% by 2030.
It’s blindingly obvious that gas, coal and electricity prices bear no resemblance whatsoever to the long term cost of production.
The price rises will result in demand destruction and substitution, but this process, eventually wonderful for decarbonisation, is of zero help to consumers negatively impacted and facing hardship and in some cases going out of business, for so long as prices stay elevated.
See: “Sorry, we can’t help today:” Energy retailers turn away customers in face of crazy prices
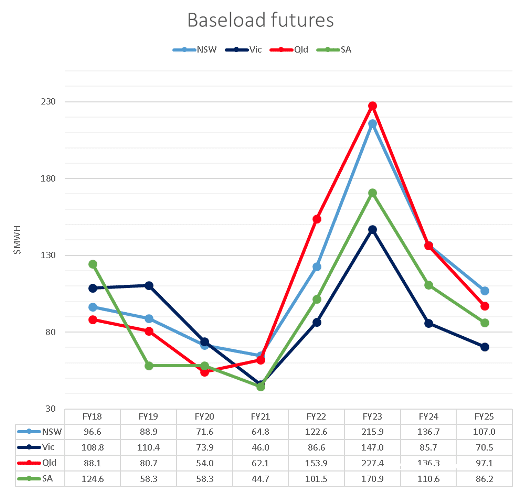
Queensland FY23 futures have risen $70/MWh in three weeks and are recently at $230/MWh, about five times where they were trading this time a year ago.
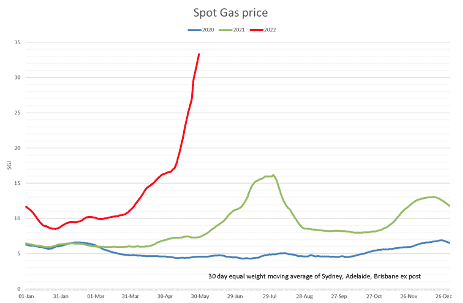
Spot gas prices are now “administered” at around $40/GJ, which for an open cycle generator means a short run generation cost of around $450/MWh.
That’s assuming generators use spot or shadow prices to estimate costs and notwithstanding some contractual cover. The figure below is a 30 day moving average of Sydney, Brisbane and Adelaide, hiding the worst of the recent horror.
Trader mode moves to “stronger for longer”
Markets trade partly on reality and partly on perception. Animal spirits shift around and generally one theme or another takes hold. At present all the ingredients have mixed together to drive not just present prices, but expectations of future prices, to record levels.
As ITK has been saying for more than two years, the seasonal softness of solar in Winter provides thermal generation with its best pricing power opportunity.
The figure below shows how total VRE (wind, solar, behind the meter) drops down at this time to a level barely above the previous.

And it will go lower for the next couple of months.
When you get a cold snap demand shoots up, particularly in Victoria and NSW. You can see the seasonal pattern very obviously and, in fact, calendar year-to-date demand is up 1%.
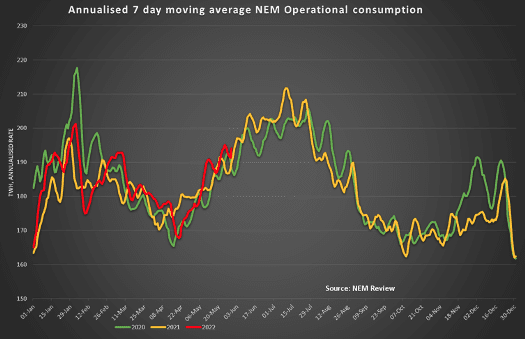
So using the annualised data, which makes it look a bit more extreme in Winter, supply from wind and solar drops down an annualised 20 TWh (10% of annual demand), and demand itself goes up about an annualised 40 TWh. This makes say a 70/200 =35% increase in demand for thermal power in Winter. Then in Spring it all reverses.
The real thing, though, is that the incredibly high fuel prices, and they are incredibly high, plus the seasonal reduction in solar output and the cold weather growing demand, just add up to a supercharged electricity price.
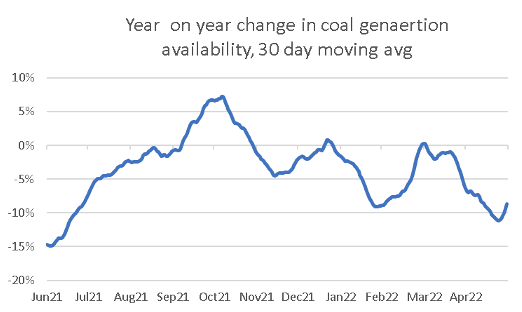
And as RenewEconomy has previously written, there is lots of coal generation capacity out of action for one reason or another.
Most of the time coal generation availability, using a 30 day moving average, has been running at say 10% below last year. Availability is not the same as operating. But it’s available at a price.

And traders, being traders, and consumers being consumers, and analysts being analysts, we all end up projecting what’s going on this week into the future.
So for the time being, the cost of production of coal and gas, the influence of new wind and solar projects coming on line, the incentives to build new batteries are all pushed to one side and the market moves into the phase of “stronger for longer”.
Futures don’t project the future, but …
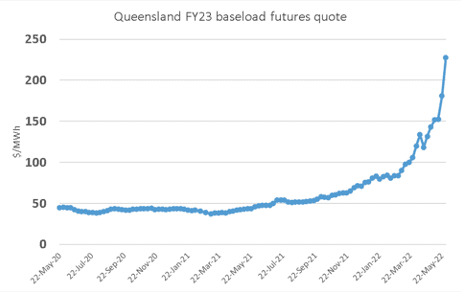
That the electricity futures market doesn’t accurately predict the future is obvious just from looking at the above figure showing the Queensland FY23 baseload quote.
A year ago the market thought the appropriate value was $43/MWh, three weeks ago they though the right value was about $160/MWh. Now the market thinks $227/MWh is the go.
Therefore, one cannot conclude from looking at the futures quotes that prices will in fact be a long way above cost for the next 2-3 years.
Instead, any analyst worthy of the name will try to look at the fundamental drivers. The expectation will always be that in the long run producers will need to recover total costs, that is the annualised cost of building new plant and all the operating costs, what economists call Long Run Marginal Cost [LRMC] and what in the electricity industry is called the Levelised cost of energy [LCOE].
Keynes wrote:
“The long run is a misleading guide to current affairs. In the long run we are all dead. Economists set themselves too easy, too useless a task if in tempestuous seasons they can only tell us that when the storm is past the ocean is flat again.”
The point being that us analysts need to focus on how prices will move from where we are to this notional equilibrium of LRMC that is rarely, if ever, observed for more than the briefest of moments. And in fact the main use of LRMC is around judging whether new investment can be justified or not.
Demand and supply
Electricity demand is not going to change much other than seasonally over the next year or two. If the price rises are passed through to consumers there will be some modest impact on consumption but not much. Demand is up about 1% this year to date and this is a positive in the long run
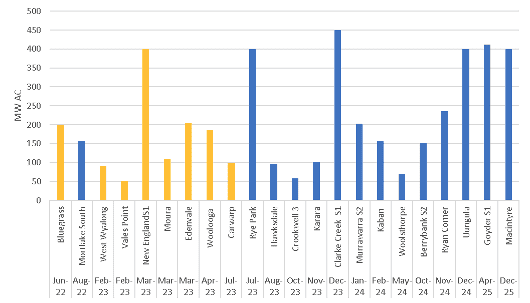
As for new supply, we still think that there is around 7GW of supply in various stages. This ranges from already completed years ago but they can’t make it work stuff like the 300MW at Moorabol and the 250MW of the second half of Stockyard Hill, through to the McIntyre wind farm where some soil has finally been turned.
Look at the summary below (which doesn’t account for the NSW roadmap, includes Eraring even though the Eraring closure comes right at the end of the three-year window we think about, and also ignores Yallourn which is going to ramp down, but still):
| Supply change excludes NSW roadmap | ||
| GW | TWh | |
| Under construction | 4.6 | 12.1 |
| Commissioning | 1.5 | 3.9 |
| 3 Year rooftop | 3.0 | 3.9 |
| Total VRE | 9.1 | 20.0 |
| Thermal | ||
| Tallawarra B | 0.3 | 0.7 |
| Liddell | -1.5 | -7.2 |
| Eraring | -2.9 | -11.6 |
| Callide C | 0.8 | 4.9 |
| Total thermal | -3.3 | -13.2 |
Figure 8 New supply summary. Source: ITK
Of course, there are also the Snowy investments.
In theory that 6-7GW of new capacity should be sufficient to just about replace Liddell and even Eraring at least in terms of energy.
In terms of supply that is committed and or under construction our list comes to about 4000MW, dominated by solar and then wind coming in later. Pretty much the reverse of what the ISP thinks, but there you go.
In addition, Moorabool’s max production to date is 99 MW versus capacity of 330MW, and Stockyard Hill 287MW out of over 500MW capacity.
Western Downs solar farm currently has max production of 27MW out of 400, but is progressing its commissioning. Port Augusta is yet to produce in bulk. In total we estimate about another 1.5GW that is either not started commissioning or not fully commissioned.
If we call for a total of 5GW and assume an average capacity factor of 30%, that’s around 13TWh of energy, or 6% of NEM wide total demand that will come on line over the next 3 years, but really that’s tiddly winks compared to what’s required.
For rooftop solar there is also a likely additional 6GW over three years. The industry was slowing down this calendar year but the high prices will almost certainly give it a lift.
That is what prices are supposed to do. We use 15% as the capacity factor for rooftop so 6GW is about 7.5 TWh of energy which is enough to run a big aluminium smelter
In addition, construction at the new gas plant at Tallawarra is proceeding smoothly and there will be a couple of batteries, but against that there are the closures of Liddell, Eraring and what ever happens to LYA and Yallourn in Victoria and to Callide C in Queensland.
Bottom line: Only NSW has enough new supply locked in, but it will be late
Bottom line is that all the States need to do more. When Matt Kean’s program in NSW was originally announced it looked terrific and it still does.
But right now it looks like we need more than 12GW of renewable energy. Queensland needs to pull its finger out. If Queensland goes on the way it is fiddling while the State’s energy supply collapses around it and the rest of the world moves on, Queenslanders and Australians will be unhappy.
Queensland obviously needs to announce a NSW style program, ie 10-15 GW of new wind and solar by 2030 at say 2 GW per year and prepare for coal ramp downs. In Queensland, the coal can be managed by the Government to provide firming until stuff like the Borumba pumped hydro and some more batteries are ready.
In Victoria, notwithstanding what’s happening now, the brown coal guys are going to struggle, yes the offshore wind is coming, arguably at a cost of electricity that wont thrill many Victorians, but Victoria needs to do more sooner.
And yes, some more transmission is required and soon and the Federal Government can and will help with that.
There is an increasingly widespread view, most recently endorsed by one of Australia’s finest academics in the field, Professor Andrew Blakers, that the way to move forward on transmission social license is to negotiate and buy the transmission access rights instead of simply asserting the Crown’s right.
As usual, the industry broadly knows what’s required, notwithstanding dissenters and contrasting points of view, it’s the politicians who – with the exception of Matt Kean and the early work of Lily D’Ambrosio in Victoria – that have been missing in action. We elect these folk to get things done. Life is short, play hard.
Global coal and gas and fuel costs
Fuel costs depend on the global exports market for coal and gas. It’s a full time job for a team of analysts to cover that and even then events move faster than analysts can adjust.
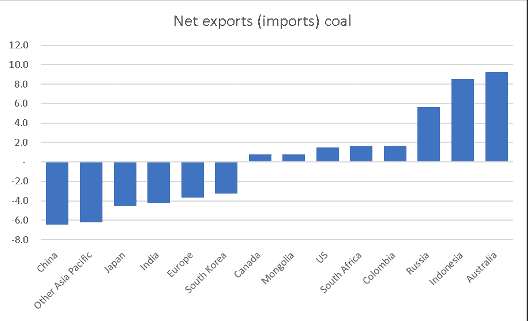
All we show below are the major consumers and suppliers, as we say taking the pulse of those markets and making useful forecasts is a big job, and frankly one with not much of a future since all the action is going to move to renewables.
Factors that are immediately obvious are Russian sanctions, whats going on in China and in India. ITK already observed that China has grown its coal supply even as demand has recently fallen.
But how that will work out is a specialist topic. Indian heat waves have temporarily driven coal demand up. Europe is on a journey but it will take years and not everyone is on the bus, and the bus may have to reverse to go forward.
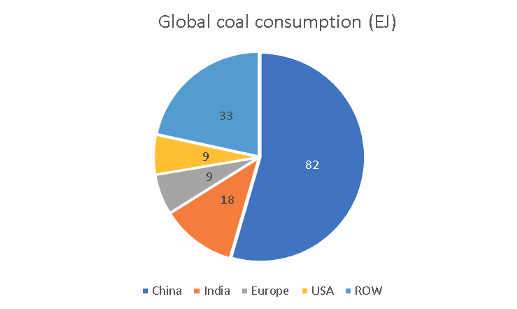
So, to be clear, BP puts global coal demand at 150 exajoules or maybe 5.5 billion tonnes. Global trade is about 30 exajoules but it is global trade that sets the global price. If you look at the major importers and exporters you can quickly see how hard it is to keep track of the global picture.
For gas, I show the numbers as a table but observing once again that the cost of transporting gas is high and this acts as a trade barrier.
| Gas Consumption and imports | ||
| Europe (Exajoules) | 19 | 14% |
| USA | 30 | 22% |
| Russia | 15 | 11% |
| Middle East | 20 | 15% |
| China | 12 | 9% |
| Japan | 4 | 3% |
| ROW | 37 | 27% |
| World total | 137 | |
| Of which | ||
| Pipe imports | 29 | 21% |
| LNG imports | 18 | 13% |
| Local production | 90 | 66% |
Figure 12 Global gas consumption and imports. Source: BP
Russia produces about 16% of world gas consumption but uses 60% of it itself.