Price action in most major markets was muted in the past week. The markets trade steadily but need to anticipate:
- The Form of Victoria’s reverse auctions. How will the Victorian Government pass on the cost of the electricity procures to consumers?
- Release of the final version of the Mugglestone Report in Queensland. There really isn’t any obvious reason to delay this.
- Federal Court decision in Australian Energy Regulator v Australian Competition Tribunal. This is as vital decision that impacts electricity prices for all consumers.
- Finalisation of the Finkel report due in the middle of this year
Turning to the weekly action
- Volumes: cooler weather (as much as 3C below last year in Melbourne) saw NEM wide volumes up 4% compared to previous corresponding period (PCP) driven by NSW and Vic. Qld remaind soft. For the CYTD (calendar year to date) volumes are flat, down in Victoria up in NSW. At this stage our guess is that volumes for the calendar year will end up marginally ahead of 2016.
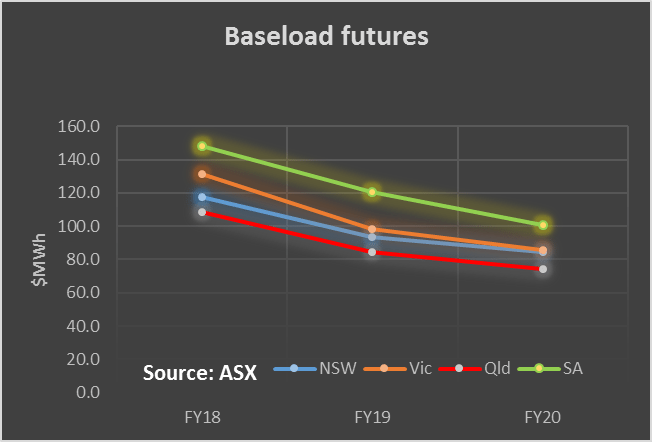
- Future prices.. were largely unchanged this week. Again we draw attention to the fact that prices in the out years are lower than for 2018. For instance the very lightly traded FY2020 NSW price is at $74 MWh compared to $109 MWh for FY18
- Spot electricity prices were well up on last year 160% in the case of Victoria, but only 57% in NSW. In the current Autumn conditions NSW and QLD spot prices are noticeably below those of Victoria and South Australia and Tasmania
- REC
- Gas prices . Drifted slightly but no real change
- Utility share prices.. Redflow’s announcement that production has resumed saw its share price up 31% on the week, to be still down 40% on last year. Tilt shares lost 8% for the week after its outlook statement indicated that profits would be less in FY18 than FY17. Origin’s Stockyard Hill deal combined with some renewed confidence in the oil market saw its share price up 5% for the week and 20% since Jan 1 just about matching the 22% for AGL. AGL announced that Stephen Mikkelsen head of energy markets and former CFO will be stepping down. Stephen was well regarded in the market.
- Overall the larger utility shares have done quite well this year. Networks have proved to be good investments. Perhaps not quite as good as some think. The following chart compares the CBA and Austnet share prices over 10 years. It isn’t adjusted for dividends. Ausnet’s dividends have been better than CBAs but CBA’s dividends are fully franked for the most part. My view is that over the 10 years they are much of a muchness. During the financial crisis both shares proved risky losing more than half their value.

That said sale of 50.4% of Endeavour energy brings to $33 bn the total net benefit to the NSW Govt. balance sheet from sales of wires and poles. This money will fund the new Sydney metro (40% more rail services to the North Shore) as well as a wide range of other benefits. It also means the NSW Govt has less incentive to act in the interest of network owner and more to act in the interest of consumers. Unfortunately it still retains a minority interest in Ausgrid and Endeavour and retains 100% of Essential.


Share Prices


Volumes


Base Load Futures


Gas Prices


David Leitch is principal of ITK. He was formerly a Utility Analyst for leading investment banks over the past 30 years. The views expressed are his own. Please note our new section, Energy Markets, which will include analysis from Leitch on the energy markets and broader energy issues. And also note our live generation widget, and the APVI solar contribution.


