Summary
We updated out overall table of estimated new supply which we now put at 5.6 GW!

Of that, stage 1&2 of Horndsale (about 0.6 TWh) is up and running as would some small part of the rooftop PV projections. The rest is still to come, so let’s say about 13TWh. If we say annual demand in the NEM (excluding rooftop PV) is about 185TWh the net of Hazelwood new supply is about 2% of demand).
That will have only a minor impact on the time weighted price. However, prices in the middle of the day and the overnight market will be more heavily impacted.
The heavy duty analytical work will be on just how significant those price moves will be. Nor should we assume it’s all done yet. The absolute key event now for all the players is to see the detail of the Victorian State target legislation.
We also note that in Queensland, the final version of the Mugglestone Report (detailing the implications for Queenslanders of a 50 per cent renewable target) has been completed and handed to the government. We look forward to the release of that report and the next steps. The website only details that the report will be released in 2017.
Turning to the weekly action
- Volumes: In the week to May 5, NEM wide volumes were up 2% this week vs previous corresponding period with all States other than QLD showing an increase. In QLD it now appears the reduction in output from the Boyne Island (Gladstone) smelter is sufficient to drive down growth. Cooler weather probably drove the higher volumes in NSW and possibly in the other States as well
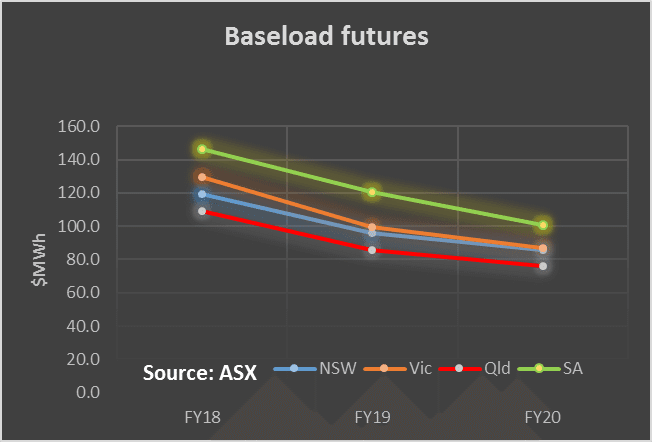
- Future prices. For the first time in a year there was a visible reduction in NSW futures prices as compared to four weeks ago, with most other States essentially flat. NSW is the balancing market in the NEM, a net importer from both Qld and Vic and so its where we expect the underlying balancing price to show up. Still futures prices remain about $85 MWh even in 2020. To us this seems about the right price longer term as we head to a high renewable future. The key question is what impact is the 13TWh of new supply under construction going to have on price?
- Spot electricity prices remained 90% up on PCP again other than QLD at over $100 MWh. Prices remain high considering it’s the shoulder season. It’s interesting to note that with QLD spot prices lower than those in NSW the incentive to shift power South has resumed.
- RECs: A further key consideration for the market will be to carefully sift through the new renewable supply to work out which will contribute to the LRET target and what won’t. Stockyard Hill, the largest wind farm to be built in Australia to date will contribute to that.
- Gas prices. Drifted slightly but no real change
- Utility share prices.. There was little significant change in share prices this week. For ORG the softness in the oil price will be of concern. Our share prices only go to Friday but we note that Redflow has resumed shipments of its flow batteries.

Share Prices


Volumes


Base Load Futures


Gas Prices


David Leitch is principal of ITK. He was formerly a Utility Analyst for leading investment banks over the past 30 years. The views expressed are his own. Please note our new section, Energy Markets, which will include analysis from Leitch on the energy markets and broader energy issues. And also note our live generation widget, and the APVI solar contribution.