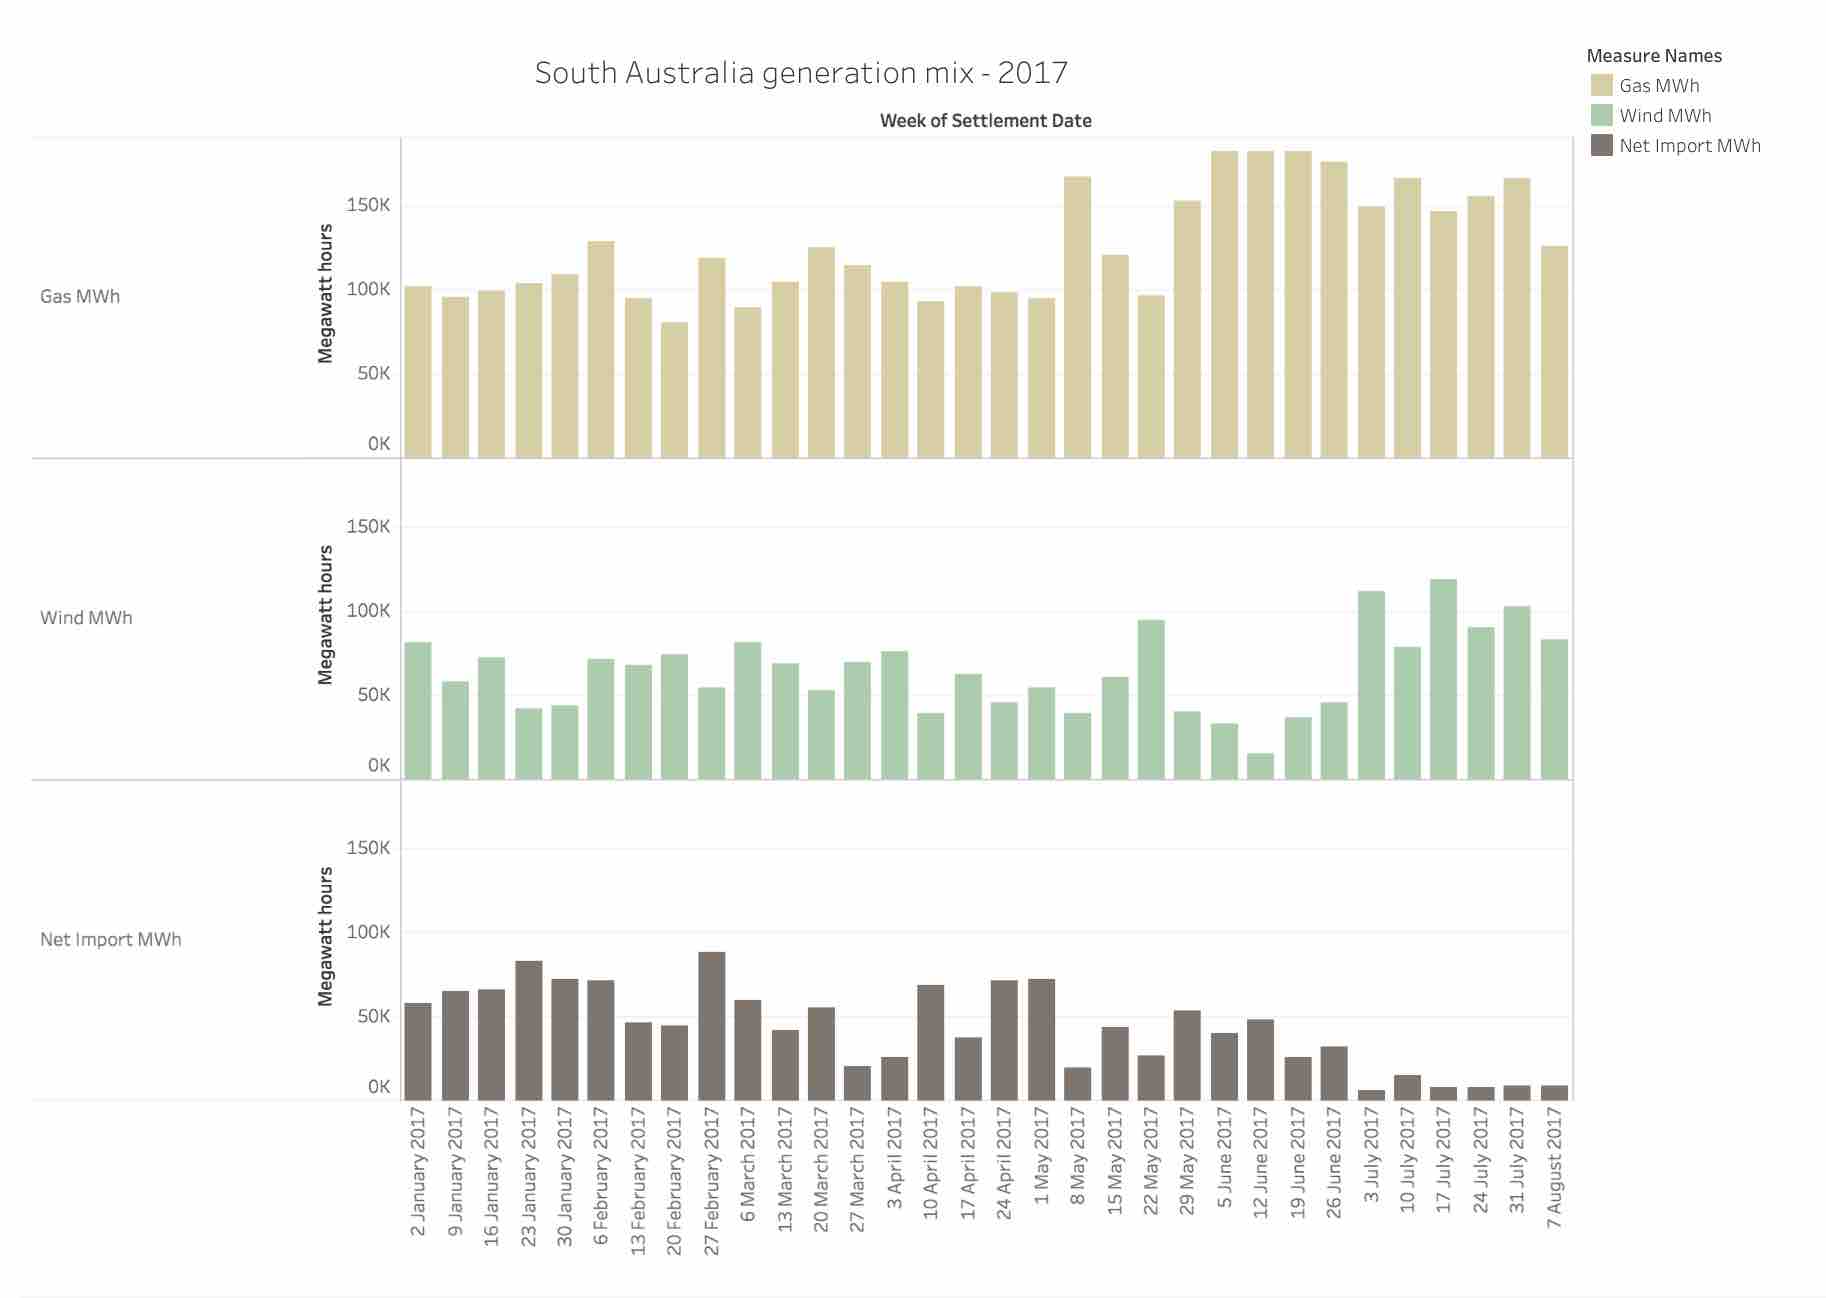
Today’s chart is a simple illustration of shifts in the fuel mix so far – interestingly, after a low-wind month in June, July’s high wind output means very little reliance on Victorian imports and lower exposure to high-priced gas in SA.
This illustrates the advantages of wind power but it also shows the un-realised further benefits of firmed wind power – once you start dispatching low-cost resource, it’ll reduce reliance on Victoria, add grid stability and also, quite importantly, reduce the amount of gas being dispatched in the state, resulting in (presumably) lower prices.
Click on 'Full Screen' to view full graph.
Author: Ketan Joshi. Reproduced with permission.


