With 30 chapters that cite more than 12,000 scientific papers and reports, there’s a lot of material — and a lot of words — in the newly released Intergovernmental Panel on Climate Change report looking at the impacts of global warming.
But the report is also chock full of illustrative tables and diagrams that make the effects of global warming clear at a glance (and some not so much). After all, it’s one thing to read a description of the rise in flood risk expected to occur along the world’s coasts because of sea level rise and in urban areas because of their inability to absorb the water from more frequent and intense downpours, and another to see the dramatic uptick in people likely to experience major floods in graph.
To help illustrate the stark predictions of the IPCC report, Climate Central has pulled out 8 illuminating graphics that each tell an important global warming story:

100-year floods: More extreme precipitation, expected with climate change, means that major flood events could happen more often and thus more people are likely to be impacted. By 2100, hundreds of millions of people per year are projected to have to deal with the challenges flooding poses, the IPCC shows in the above graph. That graph even keeps population steady at 2005 levels, meaning even more people will be under threat with population rise.
Averaged globally, annual flood exposure increases 4-14 times over the course of the 21st century compared to the 20th century. Using a moderate population growth estimate increases that risk by 7-25 times.
Nearly all of China and India as well as large portions of South America and Sub-Saharan Africa are the places where severe flooding is most likely to become more regular, while parts of Europe and North America are likely to see severe flooding risk actually decrease. That’s part of why the IPCC report notes that the poorest and most vulnerable are likely to suffer the most from climate change.

Fisheries on the move: The best fisheries are likely to shift to mid-latitude oceans by the middle of the 21st century. However, the tropics and Southern Ocean fisheries will likely suffer over the period as oceans become too warm and net ocean productivity decreases. Not only will fisheries shift but the maximum weight of fish will change too. In some areas, such as the North Atlantic, the increase in catch potential will at least be partially offset by a decrease in fish body weight.
This redistribution of catch potential also has major implications for food security. According to the report, 400 million people eat fish as a central part of their diet.

3.6°F means more risks: Climate impacts are already occurring, but so far they’ve caused relatively low levels of risk. However, future temperature increases will pose dramatically higher risks to both human and natural systems. Ecosystems as well as human systems that are highly specialized are most at risk to these impacts.
The growing body of science around understanding the impact climate change could have led the IPCC to add a new category of risk for this report: Purple is the new red. While 2007 only classified climate risks from neutral to high ranging from white impacts to red, the new report adds a purple category for very high risks.

75 percent: A growing number of studies project that crop yields will suffer due to rising temperatures and shifting rainfall patterns. By the end of the 21st century, an alarming number of studies are predicting substantial reductions in crop yields and roughly 75 percent of studies indicate at least some decline in global crop output. Some decreases are already apparent. According to the new report, “Negative impacts of climate change on crop yields have been more common than positive impacts.”
While climate change could reduce crop yields throughout the 21st century, population growth will mean there’s more mouths to feed. That combination means food insecurity is likely to increase and poverty is likely to become more entrenched in the world’s poorest places.
“Climate change will slow down the pace of poverty reduction, jeopardize sustainable development, and undermine food security,” the report said. “Currently poor and food-insecure regions will continue to be disproportionately affected into the future.”

99 percent: Coral reefs depend on a delicate balance of temperatures and acidity to grow. Disruptions can spell disaster for them and cause widespread bleaching and die offs. For example, in 2005, a bleaching event affected 80 percent of the corals in the Caribbean and resulted in 40 percent dying off completely.
Natural factors such as large El Niños, which warm the surface waters in the equatorial eastern Pacific, can cause bleaching, but climate change will also play a hand by raising the temperature and acidity of the ocean. The new IPCC report indicates that by the 2090s, almost all reefs will experience at least one severe bleaching event during the decade if greenhouse gas emissions aren’t slowed. Some coral have already responded to the current levels of warming in the ocean by moving away from the tropics where waters are becoming too warm. However, ocean acidification, which can break down coral before it can form a reef, will likely limit the ability of corals to establish colonies.

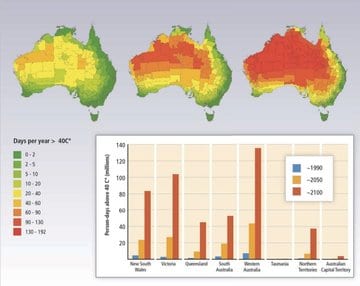
130 days of heat down under: The section of the WGII report dealing with Australasia includes a figure that Australians won’t be happy to see. It shows that extreme heat is like to increase in the Land Down Under under a high emissions scenario. The IPCC graphic shows how many more days of temperatures above 104°F Australia will see. Large portions of the country could see more than 130 days above that threshold by 2100.
Aussies have already suffered through two summers of record-setting heatwaves, with temperatures in some of the eastern parts of the country reaching 113°F in January 2014. A January 2013 heatwave impacted even more people and set the stage for Australia’s hottest year on record. A study published last summer found that global warming increased by more than a factor of five the odds that Australians will see such punishing heat waves.
Of course, the IPCC scenario is based on one model — other models might vary on the number of days, and if greenhouse gas emissions are curtailed, the number of such terribly hot days would likely be smaller.

Melting ice: The heat building in the Earth’s atmosphere and oceans is having a substantial impact on the world’s ice, from the polar ice caps to mountain glaciers. These glaciers are an important source of water for mountain communities as well as those downstream.
One figure in the IPCC WGII chapter on Asia shows the declines that have been observed in the areas of glaciers in the Tien Shan, Pamir, and Altai-Sayan mountain ranges of Central Asia from 1960-2008. The report notes that where multiple surveys have been done on the glaciers, these losses are accelerating.
The ranges of loss vary from place to place depending on the size of glaciers (as smaller glaciers shrink faster) and how much protective debris covers the ice, among other factors. The interplay of temperature and precipitation changes will determine overall what happens to these key reservoirs of fresh water, but the report says that overall they are expected to decline, with resulting impacts on the surrounding societies.

Europe’s extremes: “There will be a marked increase in extremes in Europe,” the IPCC warns in its chapter on the continent. An accompanying figure looks at the effects of two different scenarios of greenhouse gas emissions on the climate of Europe compared to the 30-year baseline period of 1971-2000.
While a lower set of emissions (on the left-hand side) would cause a slight increase in the number of heatwaves, the highest emission scenario sees a ballooning of intense heat episodes. A heat wave that hit continental Europe in 2003 contributed to the hottest summer there on record since 1540, according to the World Meteorological Organization (the United Nations entity that helped create the IPCC). That heat wave caused tens of thousands of deaths across the continent, where citizens have less experience with such intense heat and are less likely to have air conditioning.
Under both emissions scenarios, precipitation is projected to increase across much of Europe, though decreases are expected across much of southern Europe, which will see, as a consequence, more dry spells. Extremes of wet and dry can tax crops and urban infrastructure.
Source: Climate Central. Reproduced with permission.