At the start of this month, Joe Romm at Climate Progress published a story and some charts covering the “most comprehensive ‘Reconstruction of Regional and Global Temperature for the Past 11,300 Years’ ever done,” which, he wrote, “reveals just how stable the climate has been – and just how destabilizing manmade carbon pollution has been and will continue to be unless we dramatically reverse emissions trends.”
Back then, Romm said that the study by researchers at Oregon State University and Harvard University – the findings of which were published on March 08 in the journal Science – illustrated that carbon pollution was causing the temperature to change “50 times faster than it did during the time modern civilization and agriculture developed, a time when humans figured out where the climate conditions – and rivers and sea levels – were most suited for living and farming. We are headed for 7 to 11°F warming this century on our current emissions path – increasing the rate of change 5-fold yet again.”
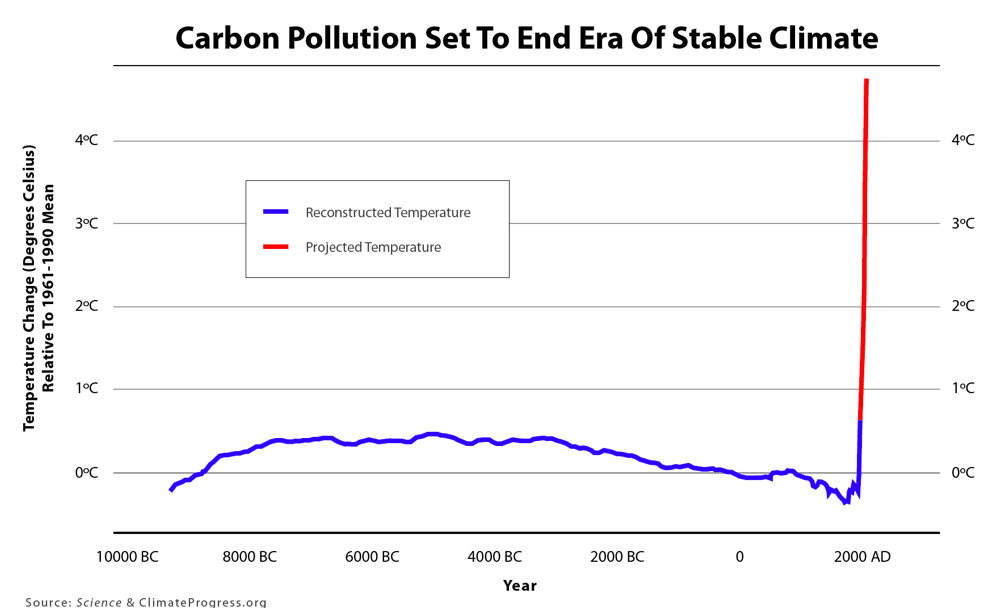
To read the whole story, click here. But below are Romm’s updated high-resolution and Celsius versions of the chart he posted 10 days ago:

Temperature change over past 11,300 years (in blue, via Science, 2013) plus projected warming this century on humanity’s current emissions path (in red, via recent literature).
The high-resolution F version is here and the high-resolution C version is here.


