Energy analysts at global investment bank Citigroup suggest that the cost of solar PV modules could fall beyond most expectations in coming years – and reach a cost of just 25c a watt by 2020.
The prediction is included in an analysis of the market forces that are likely to shape the world’s energy future in the coming year. We reported on the major part of that report last Thursday, but Citi’s estimates on the cost of solar PV are intriguing, because they are well below most forecasts.
The rate of decline in the cost of solar PV in recent years has confounded most experts, even the optimists within the solar industry itself, and it has certainly taken the conventional power industry completely by surprise.
Yet there is still great divergence of opinion about what the future holds, and what the anticipated rationalisation among solar module manufacturers might mean.
The US Department of Energy, for instance, says its Solar Sunshot program aims to get the cost of solar PV down to $1/watt by 2020 (50c/W for the modules, the rest in balance of systems costs) – a situation that would deliver energy at a levellised cost of around $60/MWh, making it cheaper than new coal and gas-fired generation.
Bloomberg New Energy Finance makes a similar forecast. Greentech Media recently lowered its forecast for solar modules to 42c/W by 2015. On the other hand, Australia’s official government forecaster, The Bureau of Resource and Energy Economics, suggests that the starting point is higher than most current estimates, and predicts solar PV will not fall much below $140/MWh by 2020, and then make little progress over the following decade.
Citigroup’s report paints a very different picture in the two scenarios painted by the Citi team led by Jason Channell.
The first scenario, dubbed “single speed” expands on recent experience, which shows that the cost of solar PV has fallen around 22 per cent for each doubling in installed capacity. This is a variation of Moore’s Law, which held that there is a doubling of chip performance in computer hardware every 18 months.
Based on a continuation of that trend, and forecasts of solar PV capacity rising from around 100GW now to 500GW by 2020, Citi’s predictions fall in line with the market average, with a module cost of around 53c/Watt. Citigroup says any variations would be dictated by short term supply or demand effects.
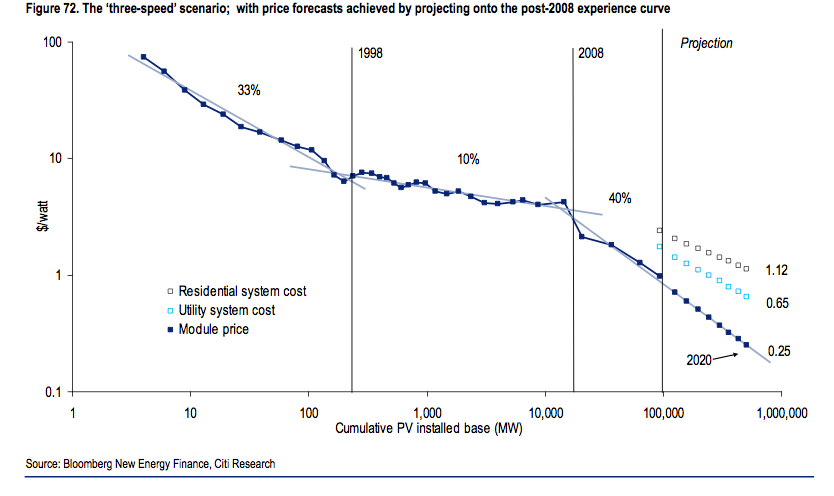
But, in its “three speed” scenario, Citi works on the assumption that the cost of solar PV modules has evolved through three phases. The first was the ‘experimental’ phase, prior to 1988; the second was the ‘industry-development’ phase between 1998 and 2008; and the third was the ‘mass-production’ phase, after 2008.
Citi says that in this scenario a different ‘experience curve’ drives each phase of development, and extrapolating the curve of the mass-production phase delivers a markedly different outcome by 2020. It expects this third phase will set the speed for cost reductions in the future.
Modules are not the only major cost. “Balance of system” costs – which include such things as inverters, mounting systems, installation costs and planning approvals. It once accounted for just 30 per cent of total costs, but BoS is now up to around 50 per cent, thanks to the plunge in the price of modules, and in the USA it accounts for three quarters of the installation costs, thanks to a complicated approvals process and other red tape.
As the graph below shows, the Citi analysis suggest that ratio could stay, at least in the US. It expects total costs of residential-scale installations at $1.40/watt in its single speed scenario, and at $1.12/watt in the three speed scenario by 2020. That compares to around $2.40/watt today.
For utility-scale installations, Citi sees the corresponding costs at $0.93/watt for the single speed scenario and $0.65/watt in 2020 in the three-speed scenario, with module costs at 25c/W – well below the DoE’s Sunshot ambition. This compares to total system costs of $1.75/watt today.
What does this mean for rooftop PV and utility scale PV?
Citi has a stab at it here. In the rooftop market, Citi notes that rooftop solar PV is already better than average residential prices in Australia, Germany, Spain, Portugal, and the South-West of the US and is not far away in other countries; it forecasts Japan will get there in 2014-2016, South Korea in 2016-2020, and the UK(!!!) in 2018-2021.
Even in countries that have solar insolation of 900 kWh/kW/year – think Germany, the UK and Russia – the LCOE of rooftop solar has declined from over 60$c/kWh to under 30$c/kWh.
In the utility scale market, Citi says solar PV will be competitive with gas fired power in the medium term in many regions, even if gas prices stay low. For regions with solar insolation of 1900 kWh/kW/year – as in the South-West US or Saudi Arabia – utility scale solar is already cheaper than gas-fired power at a natural gas price of $15/MMBtu, and by 2020 for a gas price of around $6– 8/MMBtu.
Citi says utility-scale solar is rapidly approaching parity with wholesale electricity prices in a number of countries, including Italy, Spain, the US and China. Depending on the scenario, utility-scale solar could reach parity in Italy as early as 2018, and Spain as early as 2021.
“By 2020, we calculate that utility-scale solar will be competitive with gas-fired power for a broad range of natural gas prices,” it writes. Under the optimistic assumption that the gas price reaches ~$16/MMBtu, utility-scale solar would be cheaper than gas-fired power in all key markets around the world, including the UK, Russia and Germany.
In the US, utility-scale solar located in the South-West would be competitive with gas-fired power at all gas prices over $6-8/MMBtu, depending on whether solar prices fall according to the ‘single-speed’ or ‘three-speed’ scenario. Even with the current shale gas boom, that is where US gas prices are forecast to settle in the medium term.
Here are the graphs that illustrate the most recent points:
The first illustrates how quickly rooftop solar can reach parity with retail electricity prices in various countries, depending on the amount of sun they receive (bottom axis). Australia, for instance, has good solar and reached parity in 2010.
The next set of graphs shows the two scenarios for utility scale PV compared to wholesale electricity price – guided by year and by insolation.
In Figure 87, the various colour lines represent the level of solar resources. By 2020, it means solar PV in the single speed scenario is competitive with gas at $7/MMBtu by 2020 in sunny regions, but only with gas at $19/MMBtu is less sunny regions. In the three speed scenario, solar PV is competitive with gas at less than $5/MMBtu in sunny regions by 2020, and gas at $15/MMBtu in less sunny regions.


