All the energy talk in Australia in recent times has been about how much costs have increased.
Rystad, for instance, has been talking about developers wanting $100/MWh for new wind power purchase agreements (PPAs). It’s unlikely even the developers were taking that number seriously. Whatever the number, it’s a far cry from the sub $A50/MWh that we were talking about pre Covid.
On the other hand there are strong deflationary pressures coming from China: Solar panels are nearly free, wind LCOE (electricty price required to justify investment) prices have come down 50% in the past few years.
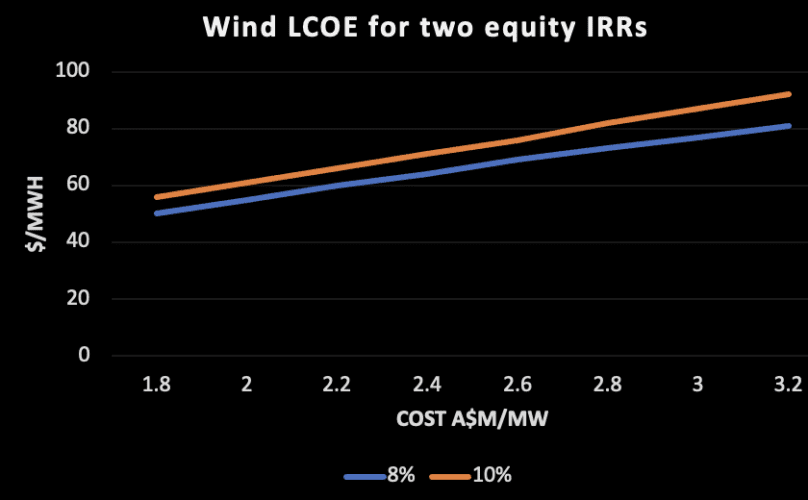
The figure below shows that increasing the target equity IRR (internal rate of return) for investors from 8% to 10% increases the required electricity price to justify the investment by about $5/MWh or $6/MWh. Increasing the capital cost from $2.4 million a megawatt to $2.8m/MW increases the required electricity price by about $10/MWh.
On these estimates there is more benefit to consumers from getting the capital cost down rather than reducing the cost of capital, via say lower interest rates or the increased certainty provided by a long term PPA.
That’s on my very simple and no doubt not fully reflective LCOE model. The numbers shown are real, that is I increase the revenue and costs by inflation each year. This reflects that investors will require higher nominal returns as inflation rises.
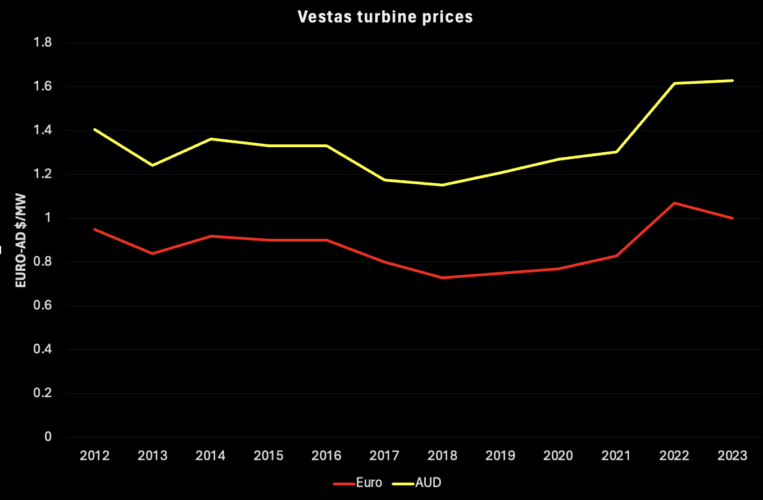
European turbine prices have changed little (that’s bad)
Vestas, the largest turbine manufacturer, outside of China and maybe globally, saw turbine prices reduce €1m/MW in 2015 down to €0.8m/MW in 2018 and back up again.
The reasons can be debated but my initial theory is that there are too many turbine classes, the distraction of offshore, being forced to have local content in every country, and insufficient volumes of a particular class to really drive costs down sustainably.
Leaving other factors aside, there hasn’t been enough growth in wind turbine orders to get the learning rate impacts that we see in solar PV, battery storage, and EVs.
However, in China the story is very different.
Goldwind released its annual results presentation only a day or two ago. Some of the data Goldwind shows is itself taken from BNEF.
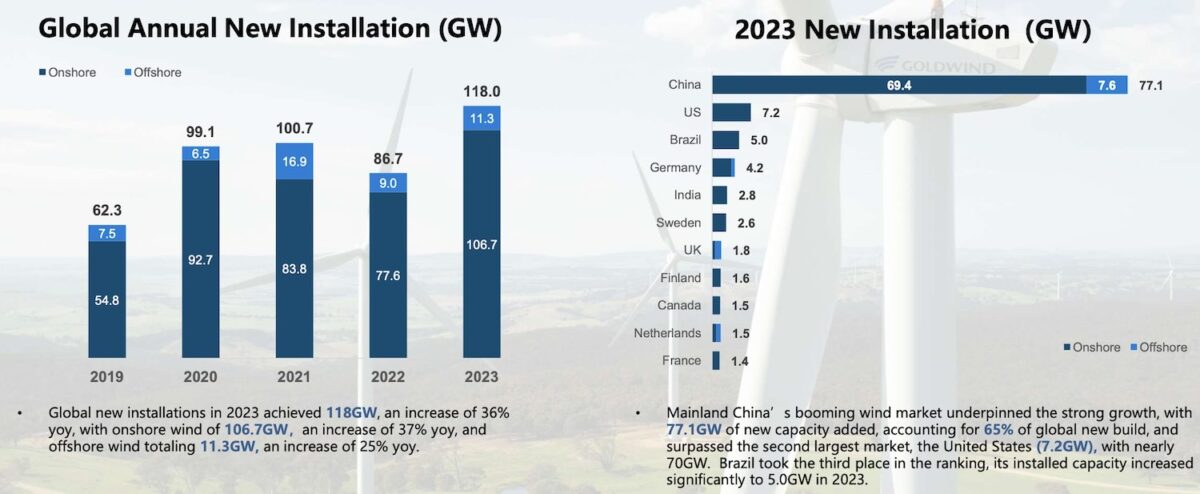
In China grid connected wind has gone from 210 GW in 2019 to 441 GW in 2023.
Normally, the learning rate is measured as the reduction in unit costs that is observed for every doubling of installed capacity. And the number is typically around 15-20%.
However, according to this Goldwind slide – using data from China Electricity Council, China Renewable Energy Monitoring Platform and IRENA – the reduction in the wind powered LCOE in China is about 53% to US$27/MWh or A$41/MWh.
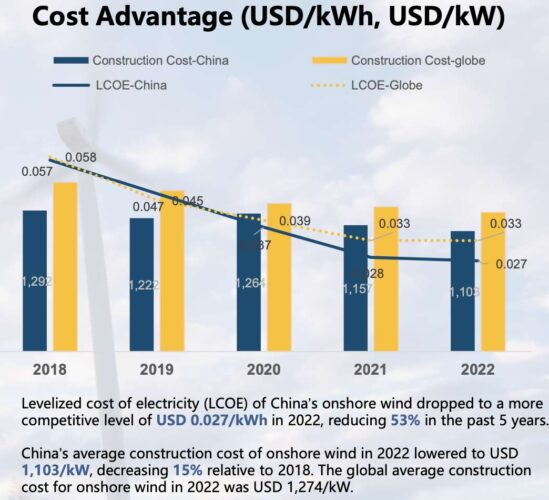
I’m no Warren Buffet, but I’m pretty sure consumers in Australia would prefer A$41/MWh to A$75/MWh or $85/MWh that they are currently quoted. However, even if one could somehow ignore China the world average cost is shown as US$33/MWh or A$51/MWh, still far lower than Australia.
Again, one might speculate on the reasons. One of the difficulties is that there is little disclsoure in Australia. We don’t have any wind turbine manufacturers, of course, and the wind farm developers are all private and cost information is guarded fairly closely.
As shown in Figure 3, onshore turbine installations in China in 2023 were 69 GW, but Goldwind’s sales (not installations) were 13 GW, so its market share in China is about 19%.
As ever, China may be a one party, communist country but competition in “new” energy markets is fierce. And that competition is to the benefit of consumers. Producers struggle. Goldwind’s return on equity was 3.5%.
Australia is 23% of Goldwind’s international installations
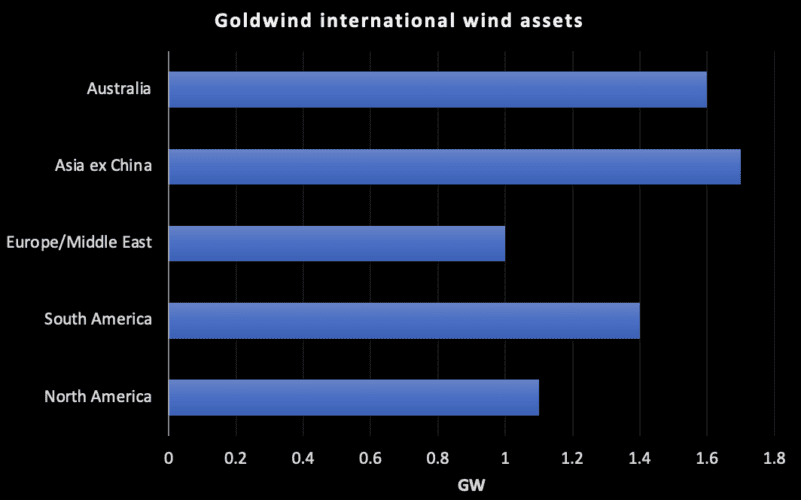
The point is whether by choosing Goldwind rather than say Vestas Australian developers couldn’t lower costs. Goldwind’s base in Australia is large enough to support further investment. As of course is Vestas.
The reduction in global solar costs is no secret
Recently, I read that solar panels were now sufficiently low cost that in Europe they are been used for fencing.
Output per panel is lower, but one can install a lot of panels that way. However, and as was speculated some years ago, panel costs are likely not as important as they used to be in the total cost of a utility scale solar farm.
And in fact there is some question about whether the cost of the solar farm is all that important. The problem being that if there is no revenue due to over-supply at lunch time then the cost doesn’t matter.
The following figure is only for the last 12 months but still shows a halving of module prices, and the forward curve that OPIS supplies also factors in still lower prices over the next 12 months. However, such sharp price reductions need to be treated with caution but will flow into solar EPC quotes gradually.

I suspect that this will leave solar EPC contracts in the say $A1.20/w-DC
All the new solar and wind isn’t moving the dial much, yet….
There must be a lot of solar in China going in behind the meter. China installed an astonishing 215 GW of solar in 2023 and 77 GW of wind.
You can see a pick up in VRE in the following figure but the growth in electricity consumption has lead to coal generation growing a lot and on the numbes I calculate the shares by fuel for the 3 months ended Feb 2024 haven’t changed over PCP.
Note that China doesn’t report January stats so I just use February numbers. Put another way, looking at 3 months ended February is the most error prone 3 months of the year. To be fair PV share is up from 2.5% to 3.0%.

We need to get the coal gen trend moving down. China coal fueled generation has added 20x Australia’s total generation in the past 8 years.