The increasing pace of the green energy transition in Western Australia – the world’s biggest isolated grid – continues to turn some age old myths on their head.
This time it’s about capacity factors of fossil fuels versus those of wind and solar. The fossil fuel industry, and their cousins in the nuclear lobby, like to dismiss wind and solar because they have low “capacity factors” the amount of power they generate per megawatt of capacity.
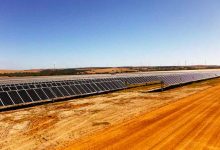
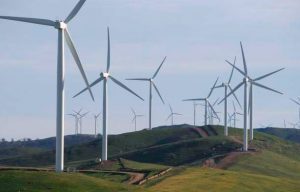
Good wind farms generally have capacity factors of more than 40 per cent, and the best solar farms more than 30 per cent. Fossil fuel generators like to boast their capacity factors are far superior. But in Western Australia, that’s no longer the case.
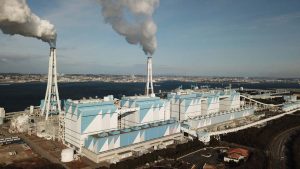
According to analysts at Rystad Energy, the capacity factor of the state’s coal generators have plunged to just 25 per cent in the month of November, as wind and solar, and even rooftop PV take centre stage.

This graph shows the average capacity factors of the various technologies in the WA grid, known as the South-West Interconnected System. Wind and solar, in a month that featured a record 43 per cent share of renewables, averaged more than 35 per cent capacity factors. Even rooftop PV got to 28 per cent.
Coal, once averaging between 50 and 60 per cent has fallen dramatically in recent months as a result of a shortage of coal at the local mine because the local contractor has run into trouble.
The two “baseload” gas generators at Cockburn and Newton have also not been working, for reasons that are not clear. The only improvement has come from “peaking” or open cycle gas plants, usually rarely used, but which have been called into action more often to deal with the lack of output at the other fossil fuel plants.
“With coal under-utilised and the CCGT’s (combined cycle gas turbines) largely switched off, it is the PV and wind fleet which is performing best in WA,” David Dixon wrote in a LinkedIn post.
“It’s a mind blowing chart,” Dixon said, and he notes it will probably get even wider over the summer months as the solar and wind farms.


