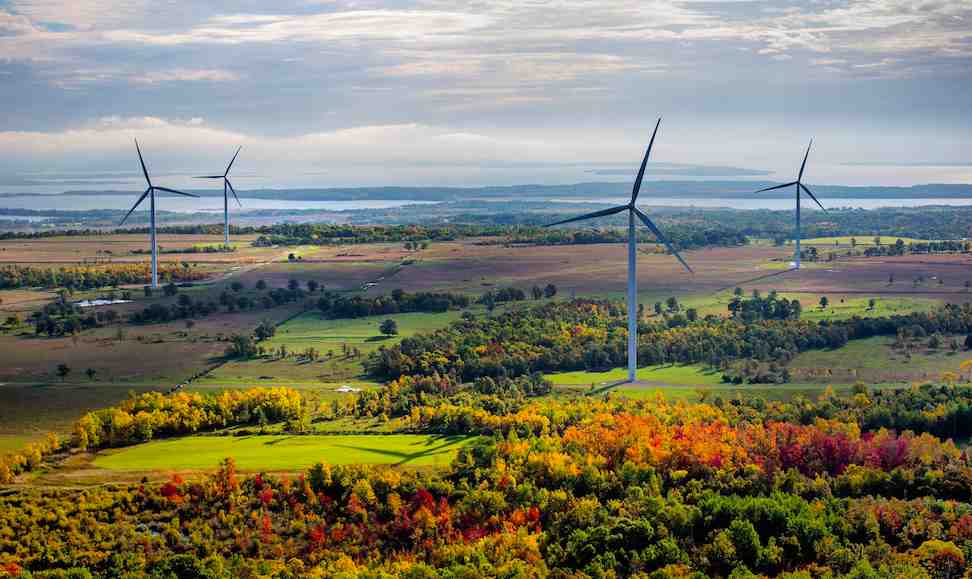

Wind energy in Australia has enjoyed its biggest every month in May, producing nearly a quarter more electricity than its previous record month, and overtaking hydro to provide 8.5 per cent of electricity demand in the country’s main grid.
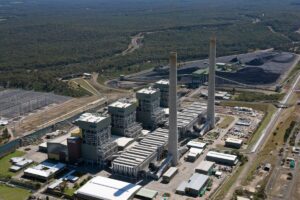
The record output came, coincidentally, in the same month that the last coal fired power station in South Australia was closed (May 9). And a new analysis from energy consultants Pitt & Sherry points to how wind generation is keeping a lid on wholesale electricity prices.
The Pitt & Sherry analysis notes that four states recorded record monthly totals in May – South Australia (where wind met 49 per cent of demand), Victoria, New South Wales and Tasmania. (There is only one very small wind farm in Queensland and Western Australia operates on a separate grid).
The 3.9GW of wind generation in the month of May operated at a capacity factor of 49 per cent, according to Pitt & Sherry, meaning that it produced 22 per cent more than it did in its previous record month (July, 2015). (See this story for more details, and how most wind farms in NSW operated at a higher capacity factor than some of the biggest coal plants).
South Australia has the biggest share of wind farms, with 1.5GW, and this accounted for 49 per cent of its electricityd emend in the month. On some occasions, wind energy provided more than 100 per cent of electricity demand in the state.
Wind energy also met 13 per cent of demand in Tasmania, 12 per cent in Victoria (nearly twice as much as hydro) and 4.8 per cent in NSW (also more than hydro). As a comparison, the capacity factor of the wind farms in the National Electricity Market in March was just 23 per cent.
What’s also of interest is the impact that wind generation has on wholesale prices. Pitt & Sherry analyst Hugh Saddler notes that opponents of wind generation often claim that increasing wind generation volumes pushes up wholesale market prices.
He says the data from recent months provides a good opportunity to test this claim against the facts, and against economic theory, which suggests that prices should be lower when there is more wind generation.
To illustrate his point, Saddler calculated the volume weighted average wholesale pool (spot) price for each of the four mainland NEM states in May and again in March.
The volume weighted price means the average price over the 744 thirty-minute trading intervals in each month, weighted by the total demand in each trading interval.
A second calculation is for the wind generation volume weighted average price, i.e. the same calculation as above, but weighted by the wind generation volume in each trading interval, rather than total demand.
The table below shows the results of these calculations. It also shows the shares of wind generation in total electricity supply in each month in each state.

In terms of comparisons between states, it can be seen that the SA price was higher than prices in the other three states in both months, but the difference was much less in May, when wind generation was high, than in March when wind generation was low.
For most of the time since the NEM was established, Saddler notes, spot prices have been higher in SA than in other states, because its local supply has, until the recent rise of wind generation, been confined to high cost gas generation and, until its closure, one high cost coal generator.
“It can also be seen that when there are large amounts of wind generation, prices are lower than the average level for the whole month and, in general, the larger the share of wind generation the larger the difference between the wind price and the total price,” he says.
“This relationship demonstrates unequivocally that, exactly as economic theory predicts, wind generation holds down wholesale prices.”
Gas generators are able to reduce output at times of high output from wind generators, and quickly increase output when wind output falls away. This reduces their need to supply at times when prices are low and enables them to increase output when prices are higher.
The Northern coal fired generator, and nearly all other coal generators, do not have the same flexibility to vary its output, so i was much more exposed to periods of low prices. “This was one of the main reasons that it was unable to be competitive in the market and was closed down on 9th May,” Saddler says.
Saddler’s conclusions are no surprise, and are consistent with what the wind industry has been maintaining all along, and with what is recognised by the Australian Energy Regulator.
The AER, which investigates price spikes and keeps a monitor on bidding patterns (necessary in a small market dominated by a few large generators), had this to say about South Australia.
Spot prices tend to be higher in South Australia thanelsewhere, partly reflecting the region’s historical reliance ongas powered generation, and its ratio of peak to averagedemand being higher than in other NEM regions.The South Australian market has been increasingly volatilesince 2007. Relatively concentrated generator ownership,generator rebidding behaviour, thermal plant withdrawals,and limited import capability are contributing factors.South Australia’s high levels of wind capacity also contributeto price swings, due to wind’s intermittent nature.
That concentration in ownership, and the bidding behaviour, is a critical element. On several occasions it has pinged generators for bidding patterns that it says have forced up the price of electricity. It says this is a particular problem in South Australia and Queensland, where a few generators dominate the market.