Renewable energy supplied an average 43 per cent share of renewables on Australia’s main grid and the Western Australia electricity market (WEM) in the first quarter of 2025, as wind and solar farms continue to edge out fossil fuels.
The latest data from Rystad Energy – both quarterly and monthly – shows utility wind and PV assets generated 4,601 GWh for the month, a 12% increase on the 4,102 GWh generated in March 2024.
According to Rystad’s David Dixon, the top performing wind and solar assets were located in Western Australia, although for sheer scale the most solar was produced in NSW, and the most wind power in Victoria.
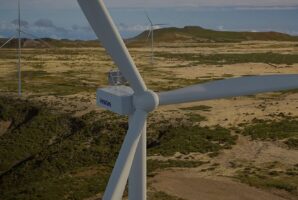
On individual assets, the top three wind projects were once again located in WA, with APA Group’s Badgingarra wind farm located near Cervantes, about 180km north of Perth, topping the charts with a capacity factor (CF) of 48.8%.
The second-best performing wind farm in March was Potentia Energy’s Flat Rocks (48.6% CF), which is contracted to support BHP’s now suspended Nickel West operations in WA. The Ratch Australia/Alinta Energy Yandin wind farm – one of the state’s biggest at 214MW – took third place with a capacity factor of 48%.

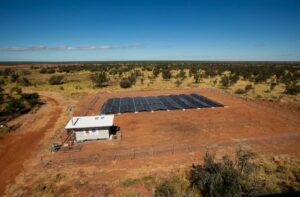
For solar, Dixon says the best performing utility-scale PV assets for the month were also in Western Australia, leading with Greenough River solar farm, the first large scale solar facility in Australia which is now also majority owned by Potentia, which scored a capacity factor of 34.8%.
Sun Energy’s Merredin solar farm took second place on the charts with a 33.5 per cent capacity factor, while Cimic Group’s Glenrowan solar farm in Victoria came in third with 33.4% AC CF.
Dixon also reports that the first quarter of 2025 saw some big year-on-year jumps in negative pricing, an increasingly common phenomenon for electricity grids with large amounts of solar and wind – and particularly rooftop solar.
It usually happens when there is an oversupply of power during periods of high variable renewable generation, and when coal fired generators bid into negative prices to avoid being shut down. It also points to a lack of storage and flexible load, and insufficient transmission capacity to export to other regions.

As the Rystad chart above shows, this was most notable in South Australia, where there were negative prices for 659 hours over the first three months of the year, or for a whopping 30 per cent of the first quarter of 2024.
Victoria, too, had a big few months of negative pricing, notching up a total of 517 hours, or 24% of the quarter.