“Sometimes I’ve believed as many as six impossible things before breakfast.” Lewis Carrol
NEG modelling is likely agenda driven, but it doesn’t matter
UPDATED: The fuller set of information released by the ESB is in our view still incomplete. No matter as it’s only modelling anyway and conclusions depend on the input assumptions.
In our view nothing short of a spreadsheet with a full set of outputs would really suffice. How can policy decisions be made on the basis of a few charts?
What company management would commit to a policy without very detailed scenario analysis? For all we know perhaps COAG members do get the spreadsheet. We, the public, have to make do with some pictures.
In any case we don’t think any decisions are going to be made on the basis of the modelling. Our view remains that the modelling was an expensive agenda-driven exercise designed to come up with a headline that prices will be lower with the NEG than without.
In our limited view you need very, very good glasses to see why that’s the case on the basis of the modelling graph results shown.
In the case of ACIL Allen’s modelling for the ESB we understand that the assumptions were provided by the ESB and run through ACIL’s proprietary “powermark” model.
Assumptions
Assumptions of note include:
– Only the first stage of the Queensland and Victorian targets were modelled. Any later stages were ignored. No explanation for this was provided except the general statement that the modelling was designed to outline differences between NEG and no NEG cases.
– Coal prices are assumed to decline from US $120/t down to US$60/t. FWIW we think this could be a reasonable assumption.
– On the technology capital cost assumptions we have two comments:
- ACIL assumes a pretax WACC rises from 6.3% to 8.9% over the forecast period as interest rates “normalize”. Higher WACC penalizes renewables compared to thermal generation. More to the point I have never read of a “normal” interest rate in the finance textbooks I studied. This must be a new concept in finance. Very broadly speaking it also runs contrary to a 30 year trend of falling global interest rates. Nevertheless it could be correct.
- It’s unclear whether the rising capacity factors of wind and even PV are accounted for.
The ESB still did not explicitly provide a graph, let alone a table, of new investment expected under the NEG case out to 2030
NEG scenario impact well camouflaged in graphs
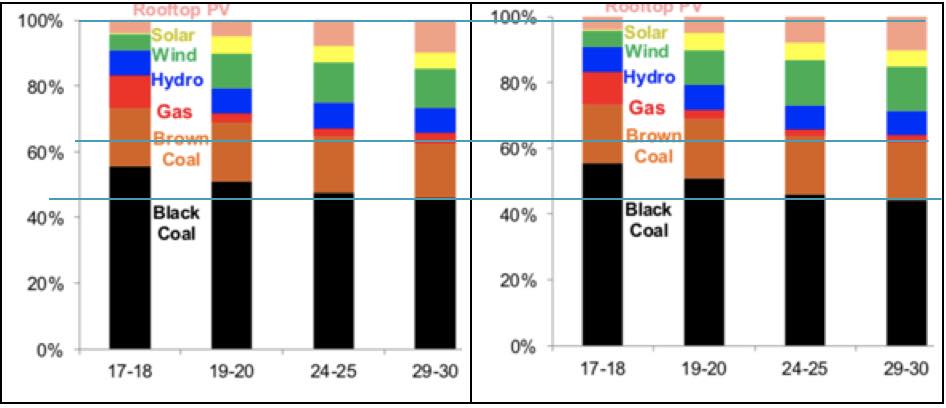
In any case shown below are four charts. Two of the charts show the energy and generation mix in the NEG case and two in the NO-NEG case.
We haven’t identified which is which because we are sure our intelligent readers can do that for themselves. Can’t you?

Spot the difference? Neither can I. Seriously. It’s ridiculous.
If you look at energy side by side the same picture emerges. In 2030, as near as you can tell from a graph the share of coal fired generation (brown and black combined is virtually identical.
One of the two scenarios has a tiny bit more brown coal relative to black coal. We couldn’t get these graphs to exactly line up so we might be missing something, but not much. The text of the report states that the renewable share in 2030 is 36 per cent under the NEG scenario compared to 34 per cent under the no NEG scenario.

Can these supply differences explain the price differences?
The ESB notes that one factor expected to drive prices lower is a 5% higher level of contracting if the NEG is passed as compared to the no NEG case. We understand that this is explicitly allowed for in the Powermark model and forces more thermal generation to be offered at SRMC.
Not sure I’d want to be contracting at the prices modelled in this report but there you go.
Clearly this provides an incentive to the generation sector to avoid contracting or to arrange things so that power is not offered at SRMC. It is axiomatic that if all power is offered at SRMC the sector will go broke.
I can recall Paul Simshauser when he was at AGL getting analysts to play a bidding game where the whole point was to demonstrate that SRMC bidding was a poor long run strategy.
Those contracting incentives must be very powerful because it stretches my imagination (never very good) that such small differences in generation by fuel outlined above could produce the much larger price differentials the modelling has come up with.
Of course demand in both scenarios is identical The price difference is modelled to something like a more than a $15/MWh difference in nominal dollars by 2025.

Final thoughts:
As stated above, I doubt the modelling will do anything other than be used as a pawn in negotiations. My personal view is it presents an unlikely scenario of what will actually happen in both the NEG and no-NEG cases.
Secondly, it’s worth restating that high prices are not an indication of market failure. Market failure, normally, is defined as a lack of activity, a lack of trading, a lack of bids and offers, or a lack of clear, transparent rules and reporting.
The REC market and the gas market probably show more evidence of market failure than the electricity market. Perhaps the OTC market also falls into that category.
Thirdly, we don’t think enough thought is being given to market design. This policy is being presented as “the policy.” However, to many of us in the industry we question whether the “energy only” market is going to work properly in a world where most of the energy is zero marginal cost.
The question, is who is getting spilled at lunchtime? And yet you still can’t get a clear enough price signal to invest in a pumped hydro plant in South Australia.
Anyhow, that’s a question for another day.
David Leitch is principal of ITK. He was formerly a Utility Analyst for leading investment banks over the past 30 years. The views expressed are his own. Please note our new section, Energy Markets, which will include analysis from Leitch on the energy markets and broader energy issues. And also note our live generation widget, and the APVI solar contribution.

