Large-scale Generation Certificate (LGCs)

With the heady experience of the final weeks of the 2019 LGC compliance year fresh in the memories of onlookers, the final steps in the journey toward Calendar 20 compliance lived up to expectations, with some major price volatility in the spot contract and, ultimately, another large under surrender of LGCs.
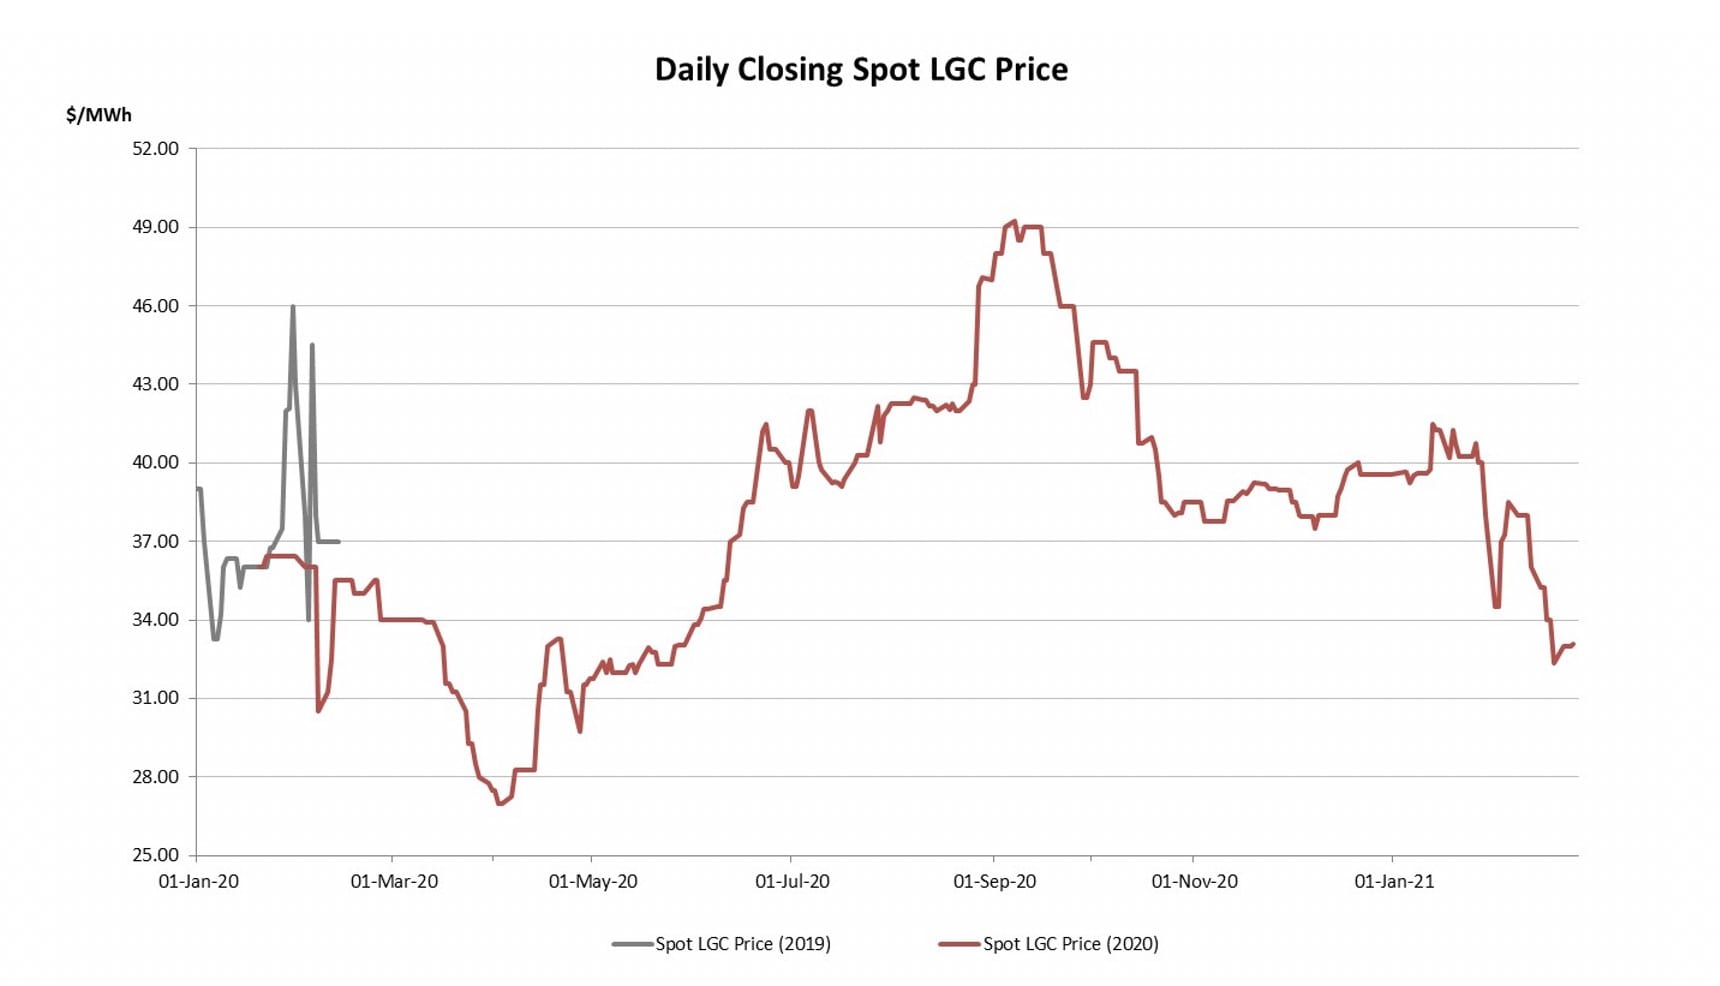
The second half of 2020 did see some major movements in LGC prices, with the spot market climbing from the high $30s to the high $40s, before heading back down again.
The forward curve, meanwhile, was strong, with the Cal 23 and 24 contracts climbing considerably across the period.
Yet the latter part of 2020 did not yield the same level of trade activity as was seen in 2019, with volumes clearly down on the previous year’s highs.
The stage was nonetheless set for an exciting finish to the Cal 20 compliance year, with the memories of the wild swings in the spot price experienced in late January and early February 2020, as participants came to the market late, looking to buy or sell and were forced to take whatever pricing prevailed, still fresh.
The potential for late volatility seemed to encourage some participants to take their chances to see whether the same phenomenon would be repeated this year. To some extent it was.
Having ended 2020 just shy of the $40 mark, the spot/Cal20 market was relatively stable until late January, trading either side of the $40 level across that time.
Then came the volatility. With buyers appearing to be running out of steam, the spot market began to gap sharply lower, falling from a $40 January close, to $34.50 in two trading days. It then rebounded to $38.50 a few days later before again softening – this time more gradually – across the remainder of the month to end February at $33.10.
What has made this period so volatile across the last 2 years has been a combination of several factors.
Firstly, that the curve is in backwardation, meaning that prices in the subsequent years are lower than the current year (spot in this case).
This means that no-one of sound financial mind would want to be left holding any LGCs beyond what they need for compliance. Better to sell spot at the higher price and buy forwards at the lower price and receive a financial reward and a cash flow benefit.
Secondly, that the supply/demand balance for each year tightened as time went by, introducing greater doubt as to whether the market would be left long or short.
And finally, that while assumptions can be made, no one really knows to what extent participants will pay the penalty until it has been done, meaning the number of extra LGCs that would be added to the surplus rolled forward into the next year is unknown.
The shortfall strategy involves paying the penalty instead of surrendering LGCs in the current year, only to make good on that shortfall by purchasing and surrendering the same number of LGCs within 3 years, a feat which in a backwardated market can be done at a considerable return.
One upon a time, adopting such an approach was staunchly avoided by Boards, with the potential brand damage to an organisation being named and shamed by the Clean Energy Regulator (CER) deemed too great a risk.
However, with the CER having changed its tune to unequivocally endorse the practice in recent years, that risk has been eliminated.
Hence it is now broadly accepted that so long as the forward curve remains in backwardation, there will likely continue to be a meaningful shortfall each year.
The 2020 compliance year did indeed see this practice repeated, with circa 5.5m fewer LGCs surrendered when compared to the target. This leaves a meaningful additional chunk (circa 18% of the 2021 target) available for purchase and thus makes it more likely that the 2021 surplus will be larger than the two previous years.
What will make this year interesting is the extent to which the same supply constraining issues that have been experienced across the last two years (project and connection delays and curtailments and other outages) play out again.
The growth in voluntary demand for LGCs is also a real factor, though whether it has yet increased to the levels to have a material impact the supply/demand balance is yet to be seen.
While an additional 5.5m LGCs will go part of the way to creating a buffer in any case, but the market has defied expectations more often than not over the last 2 years, there are those that believe it may yet do so again.
Small-scale Technology Certificates (STCs)
2020 proved an incredible year for solar installations which not only avoided a sharp decline – as was originally feared as the pandemic first emerged – but instead smashed all records, resulting in a very large surplus of STCs needing to be added to the 2021 target.
As has previously been noted, the uncertainty created in the early weeks and months of the COVID-19 pandemic saw panic spread throughout the solar industry, as participants assumed a cliff-face reduction in sales was approaching, as consumers halted spending to batten down the hatches for the impending economic storm.
In practice, what eventuated was far different, with households increasingly occupied during the day, making the very rational decision to install solar to offset an increase in daytime power consumption.
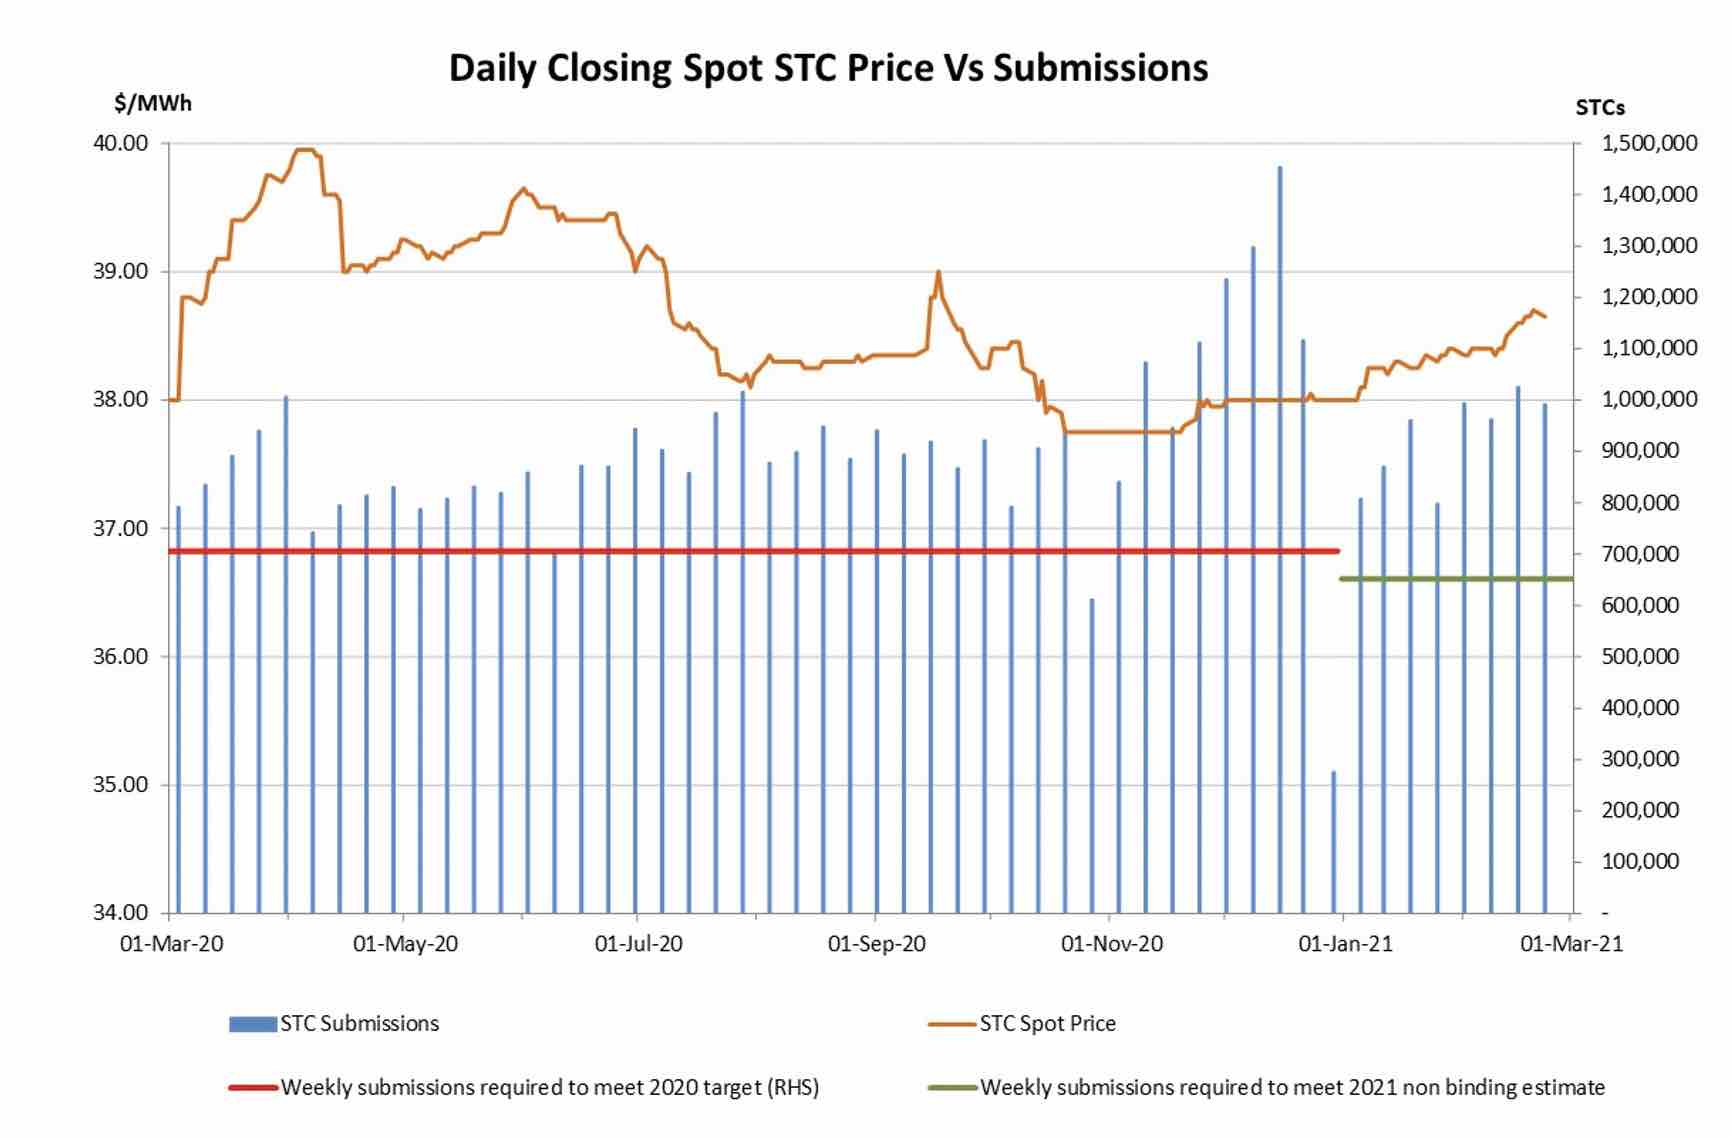
And so the STC surplus grew, in particular (as is usually the case) across the second half of the year where weekly STC submissions averaged a whopping 941k.
The net outcome of this being 46.3m STCs submitted across the year against a base component target of 36.7m, resulting in a surplus of 9.6m.
Using the Clean Energy Regulators approach to calculate the surplus, which tallies total STCs registered across the year against the base component of the target, a surplus of 9.44m will need to be added to the 2021 target.
Despite a 10% reduction in the number of STCs created per install in 2021, owing to one less year of deeming given the scheme’s conclusion in 2030, combined with the ongoing strength in installation activity and the 2021 Small-scale Technology Percentage (STP) is going to need to increase materially above the 2020 target.
Coming in at 24.4% (equivalent to 42.62m combined base and previous year’s surplus), the 2020 STP was the 3rd consecutive year of substantial increases to the target.
The 2021 STP is likely going to need to be in the high 20s to both absorb the enormous surplus from 2020 and match the eye watering rates of ongoing installation activity.
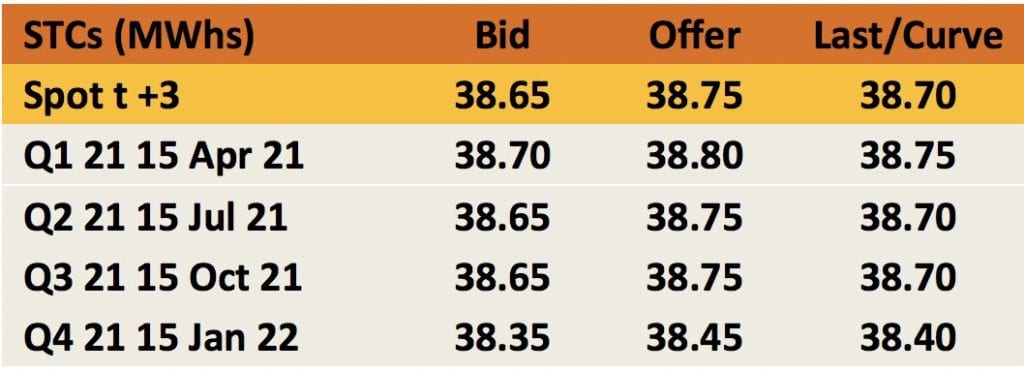
Pricing outcomes across late 2020 were remarkably stable with the spot sitting in the $37.75-$38.00 region from late October until Christmas.
The market did improve in January, with the spot climbing into the low $38s in the middle of the month, before a steadier increase across the second half off February saw the spot end the month at $38.70.
As has been the case in recent years, as the spot price has climbed from the mid $38s, forward price increases have failed to keep pace, with the curve flattening out.
With the market capped at $40, a higher spot price robs the forward curve of value to buyers to the point where the market eventually becomes backwardated.
With the 2021 target likely to be released in the coming weeks, we’ll soon see whether this familiar pattern will play out again.
Marco Stella is Senior Broker, Environmental Markets at TFS Green Australia. The TFS Green Australia team provides project and transactional environmental market brokerage and data services across all domestic and international renewable energy, energy efficiency and carbon markets.