With the 2018/19 summer period having ended, Green Energy Markets has reviewed how Victoria’s peak electricity demand was met.
This is particularly salient given the voluntary and involuntary load shedding that occurred in Victoria during extreme heat on Thursday 24 and Friday 25 January, 2019.
Importantly, load shedding initiated by the Australian Energy Market Operator (AEMO) was in effect a demand response when supply was not adequate to meet demand. We tend to forget that there are actually two sides to a market – supply and demand.
Unfortunately, the focus tends to be on the supply side.
It appears that the NEM institutions and their policy makers are not yet focused and resourced to seriously consider as a priority what can be done to reduce and manage demand before considering supply side options.
This paper goes some way to reiterating the opportunity for a paradigm shift on policy setting: to prioritise peak demand reduction.
Peak demand response on extreme heat days
When we analyse the 2018-19 summer data in detail and consider extreme heat days and the level of demand, there are several crucial developments and implications to consider in the management and development of our electricity market going forward.
Some key observations:
- Victoria dodged a bullet this summer: the cool change that came through early in the afternoon on Friday 25 January meant that demand did not continue to rise into the late afternoon, as it did the previous day. One could only imagine the level of load shedding that might otherwise have been required. We may not be so lucky next summer.
- The load shedding that AEMO triggered seems to also have offloaded a significant amount of rooftop solar PV; in future AEMO directives may need to be more explicit and target those areas with lower levels of embedded generation, which means that considerably less load actually needs to be shed.
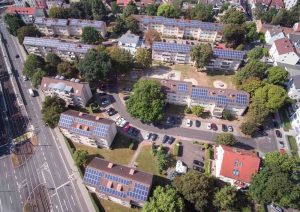
- Rooftop solar PV is making a material contribution in meeting peak demand; this contribution is however masked as it sits behind the meter and is already included in metered demand. Once we add back roof-top solar PV we see that this type of generation is reducing and delaying the peak to later in the day.
- The Victorian Energy Upgrades (VEU) scheme has supported the rollout and installation of more than 900,000 lighting upgrades (predominantly LED) that have replaced inefficient lights. We estimate that these upgrade types contributed in the order of 562 to 723MW of demand reduction that is masked in the metered demand data that AEMO publishes.
- When we consider the Victorian Government’s rollout of its rooftop solar PV program, we could see the level of rooftop solar PV treble over the next 5 to 6 years. This will mean that the peak demand challenge will be much later in the day – between 5:00pm to 9:00pm EST.
- There are a range of cost effective demand reduction and demand shifting opportunities beyond solar that should be supported and need to be prioritised.
Victorian electricity demand – over summer
Electricity demand in Victoria spiked on 24 and 25 of January, and again on 1 March, in response to extremely high temperatures.
According to the Bureau of Meteorology, a maximum temperature of 41 degrees Celsius was reached in Melbourne on 24 January with a minimum overnight low of 30 degrees.
The following day 25 January was even hotter reaching 42 degrees before a cool change came through after lunch.
Electricity consumption on a half hourly basis for the summer period (metered demand as reported by NEM Review) is set out in Figure 1.
Peak demand was 9,311 MW on Thursday 24 January at 6.00pm (EST). Peak demand on Friday 25 January only reached 9,105 MW, but it did so much earlier at 11.30am (EST), refer to Figure 2.
Voluntary and involuntary load shedding meant that demand started to fall after 11.30am and then the cool change came through after lunch which lowered demand further. On 1 March, peak demand was 9,219 MW at 5.00pm (EST).
Notably, these metered demand figures mask the contribution that roof-top solar PV is making which is seen by the electricity market as a reduction in demand. Roof-top solar PV is making a significant contribution to meeting peak demand and on 25 January it was contributing more than 900 MW (10%).
To show the contribution of roof-top solar PV we have added back its estimated generation to arrive at total demand for electricity (Figure 2).
When we look at total electricity demand (after allowing for the contribution of roof-top solar PV) we see that peak demand for the summer actually occurred on Friday 25 January at 10,021 MW at 11:30 am (EST) with roof-top solar PV generating 916 MW (9% of demand). (Refer to Table 1)
Demand would have been higher but for voluntary and involuntary load shedding. AEMO triggered its Reliability and Emergency Reserve Trader (RERT) contracts on 24 and 25 January 2019 for 365 MW and 595 MW respectively.
In addition, on Friday 25 January, it also requested that Victorian Electricity Network businesses undertake load shedding (involuntarily from a customer’s perspective) of 200 MW of load from 12.00pm.
The question of roof-top solar PV load shedding and impacts
Looking at the days where AEMO initiated load shedding events (Figure 3), the reduction in load is clearly visible on 25 January from 1:00 pm Eastern Standard Time (equivalent to 12:00 pm on eastern daylight savings time).
What is surprising is the considerable drop in roof-top solar PV generation from 12:00 pm EST. It appears that a considerable amount of roof-top solar PV was also shed.
It is crucial to understand the approach that AEMO and the network operators take in shedding load and how they consider the generation from roof-top solar PV that they are also shutting down.
The demand profiles on 24 and 25 January are quite different. The profile on 25 January is impacted by voluntary and involuntary load shedding and then the cool change coming through.
Importantly however, it was also affected by the cumulative impact of the hot weather where the minimum overnight temperature was 30 degrees Celsius in the early morning of 25 January.
This means that the air- conditioning and refrigeration load was much higher than would otherwise have been the case in the morning. If we were to add back the impact of the voluntary and involuntary load shedding and adjust for the impact of the cool change, then Victorian demand would most likely have been more than 12,000 MW.
Innovative peak demand policy options for next summer
Roof-top solar PV is making a significant contribution in reducing and delaying peak demand so that the system peak now occurs when the level of PV generation is reduced to very low levels (eg. around 6:00 pm), as occurred on 24 January which might be the more typical profile.
It’s now clear that we need to complement solar with additional demand-side solutions that act to reduce demand in the afternoon and evening. Building extra conventional generating capacity is unlikely to be sensible, given its very high capital cost can only be offset over a very narrow time window, not to mention its carbon emissions and high fuel costs.
It is estimated that the level of rooftop solar PV to be installed in Victoria in 2019 will be 500 MW (Green Energy Markets, STC Modelling Report, January 2019).
Supported by the Victorian Government solar rebate program, we have assumed that an average of 500 MW of rooftop solar PV will be installed each year over the next 5 years. This means that by the end of 2023 a total of 4,000 MW of rooftop solar PV will be installed in Victoria (2.5 times the amount installed at the end of 2018).
To see what Victorian demand might look like under this scenario, we have reconstructed the demand profile that occurred on 24 January 2019. To account for the growth in rooftop solar we have merely multiplied by 2.5 times the actual level of solar generation on 24 January to reflect 4,000 MW of expected rooftop solar (refer to Figure 4).
What is clear from Figure 4 is that rooftop PV will even more dramatically reduce demand in the middle of the day and pushes the peak demand lower and later in the day. The 4 to 5 hours from 5.00pm EST will become the problematic system peak that will need to be addressed.
Energy savings schemes already reducing electricity consumption by 5%
There has been considerable discussion about the future role of storage, be it pumped hydro or batteries. There are now a range of government programs to support the installation of batteries.
There are no programs however that specifically support reduction of peak demand beyond the emergency measures of AEMO’s Reliability and Emergency Reserve Trader mechanism.
The existing state-based energy savings schemes in Victoria, NSW, SA and the ACT are geared around emission reductions and have supported those activities that reduce overall energy consumption, rather than reduced peak demand.
As an example, residential and commercial lighting have accounted for more than 92% of the certificates created under the Victorian scheme over the past three years (Figure 5). That scheme has supported the dramatic transformation of the lighting sector with large-scale rollout of LEDs in residential and commercial facilities.
Over the six years to 2018, more than 830,000 households and 81,000 businesses have had inefficient lighting products replaced with efficient lighting, predominantly LEDs. These lighting upgrades have saved significant amounts of energy, estimated at more than 2,170 GWh per annum (5% of Victorian electricity consumption).
Importantly these efficient lighting installations would also have contributed to lower peak demand over the 5:00pm to 9:00pm (EST) period over summer. We have estimated the likely level of peak demand reduction over this period by allowing for 5,000 hours of operation for commercial lighting and 1,000 hours for residential lighting.
We have then discounted this by between 10 to 30% for the likelihood that not all the energy savings will occur during the peak 5.00 pm to 9.00pm window. The contribution to reducing peak demand is estimated to be between 562 MW to 723 MW.
Time to prioritise peak demand reduction
Incentivising peak demand reduction in the NEM has been woeful to date. So far the Energy Rule maker, the AEMC has focused on providing incentives which are exclusively available to network or retail businesses to reduce peak demand.
These have been a complete failure and there are many other businesses far more capable of delivering demand reduction products and services who are far less commercially conflicted.
When we consider the type of activities that are contributing to our peak demand over the 5:00pm to 9:00pm period the activities that cause the surge in demand are those that are driven by higher temperatures such as air-conditioning and refrigeration.
The missing part of our energy policy mix is the rollout of an effective peak demand reduction scheme that supports residential and business customers reducing their energy demand over the 5:00pm to 9:00pm period.
The second part of this paper is being developed and will consider how a peak demand reduction scheme could work.
Ric Brazzale is director of Green Energy Markets


