“Ground control to Major Tom, take your protein pills and put your helmet on” David Bowie 1969
Why read this?
Even if there was a war on, it takes time to get new transmission built. As renewable investment is accelerating way faster than most anticipated a year ago with more than 40 projects under development it’s likely that parts of the transmission grid will become constrained.
Transmission is typically less than 10% of final bills but can make a huge difference to system reliability. We argue there is more bang for the buck in upgrading transmission than just about any other part of the system.
A series of studies by the Jacob Group, the Blakers Report and a significant number of other studies all identify that lots more transmission will be required to support high renewables penetration. That’s even allowing for lots of distributed energy.
AEMO itself notes that putting a portfolio of transmission upgrades in place will deliver a portfolio benefit. Nevertheless….
A combination of fear of gold plating, a confusion of roles between the AEMO and the AER in regard to transmission expenditure, and an overly cautious and insufficiently ambitious approach to transmission development means that there hasn’t been much in recent years, outside of the Hazelwood upgrading (which still took too long) and augmentation within Queensland to support the electrified CSG industry.
Queensland has also very recently announced its $350 million Northern Queensland transmission development program.
The 2016 National Transmission Network Development Plan [NTNDP] – Australia’s fundamental transmission planning document prepared by AEMO – didn’t see any major developments happening before 2021, and mostly not until 2025.
The 2017 plan under development has five separate scenarios with various combinations of renewables policy and economic growth.
However, in the end a scenario is not the same as an action plan. So the fundamental flaw that we identify with the NTNDP is that it is reactive rather than proactive.
We contrast the planning process that AEMO undertakes with the proactive, solutions oriented approach taken by ERCOT in TX with its CREZ development.
Essentially ERCOT built the transmission and wind development then proceeded rapidly. This is no different to, say, building a new airport or train line. Build it and they will come.
We note that the Finkel report called for the development of Renewable Energy Zones, seemingly very similar to the ERCOT model.
These zones are supposed to be developed over the next 12 months.
Based on the Jacobs modelling there is a clear case for starting the second Bass-link connector today and, in our view, some of the intra-NSW contingent projects should also be started without delay.
Transmission remains at the heart of the grid
The revolution in electricity has two main themes:
(i) behind the meter developments and associated changes in the role and pricing of the “last kilometre” distribution grid;
(ii) the replacement of a few centrally placed thermal generation units with a more distributed but still centrally run portfolio of renewable fuelled generation units.
Transmission represents the arteries that carry this utility-scale power to where it’s consumed.
Most of the time the best place for wind and PV plants is (i) remote from thermal plant location and (ii) often remote from load.
Therefore it seems as if full development of renewable resource requires significant transmission development.
The argument is that if we have many wind and solar PV plants, electricity generation will become statistically more predictable. Wind in Northern NSW is only partly correlated with wind in South Australia.
If one PV farm at Moree has cloud over it, other PV farms in QLD or Victoria will not. Transmission is the means by which the system can realise these portfolio benefits of lower volatility.
Interconnectors form the part of transmission carrying electricity from one NEM defined region to another.
For instance if there was more transmission to South Australia from, say, NSW, electricity prices in South Australia would be lower than they are today, as NSW transmission would set the marginal price rather than gas.
RIT-T test – in the end it’s too bureaucratic in a dynamic situation
The RIT-T is a cost-benefit process that is applied to all new transmission network investments that have an estimated cost greater than $6 million. It was designed to replicate investment outcomes in a competitive market environment.
It does this through identifying the costs and benefits associated with a new project, along with any alternatives.
The test was recently reviewed by the COAG energy committee and, as usual, the status quo was affirmed. That is, in the Committee’s opinion, the test was still the appropriate way to justify new transmission investment.
The committee did ask that the AER application guidelines be reviewed “to better reflect the net system benefits of options including those relating to system security and renewable energy and climate goals.”
This is, of course, a joke. What are the climate goals – officially, that is? Are they federal or state goals? How is the AER to take account of them? It’s a complete ducking of responsibility.
However ITK believes that, in any case, the test is too narrow a way to think about a major reconfiguration of the electricity grid as is likely to happen in Australia over the next 10-20 years.
For instance, a new transmission link to Tasmania will likely cost between $1 billion and $2 billion.
That could only be justified if Tasmania was to play a substantially enhanced role in meeting the electricity supply needs of the NEM, and basically could only be part of a much bigger plan.
Similarly, indications are that if Snowy 2.0 proceeds, up to $2 billion of extra transmission would be required across Victoria and NSW.
This could only be justified by a longer-term view of the required reconfiguration of the electricity system.
National Transmission Network Development Plan [NTNDP]
Each year AEMO goes through a transmission planning and development process. The summary of the 2016 plan stated:
The NEM is moving into a new era for transmission planning:
- Transmission networks designed for transporting energy from coal generation centres will need to transform to support large-scale generation development in new areas.
- Transmission networks will increasingly be needed for system support services, such as frequency and voltage support, to maintain a reliable and secure supply.
- A new interconnector linking South Australia with either New South Wales or Victoria from 2021.
- Augmenting existing interconnection linking New South Wales with both Queensland and Victoria in the mid to late 2020s.
- A second Bass Strait interconnector from 2025, when combined with augmented interconnector capacity linking New South Wales identified above, although the benefits are only marginally greater than the costs.
Modelling shows greater total net benefits when these developments are combined, creating a more interconnected NEM. These benefits are projected to increase as the energy transformation accelerates.
- Geographic and technological diversity smooths the impact of intermittency and reduces reliance on gas-powered generation (GPG). Greater interconnection facilitates this diversity and delivers fuel cost savings to consumers.
- A more interconnected NEM can improve system resilience.
- Contestability in transmission should make development more competitively priced, reducing costs for consumers
ITK’s comment is that this plan seems slow and insufficient, and insufficiently linked to a more comprehensive plan for large-scale reconfiguration of the grid.
Naturally it didn’t contemplate Snowy 2.0 because that hadn’t been dreamed up a year ago.
As an analytical document it is fine. As an action plan – it’s a failure.
Blakers Study had $8.5 billion of DC high voltage transmission
The recent 100% renewables with focus on balancing cost provided by pumped hydro envisaged a broadly 2500 km high voltage transmission network that might cost around $8.5 billion. There doesn’t seem to be any scope whatsoever for the potential value of such concepts to be fit within the NTNDP.

Jacobs Study for CEFC
In November 2016 Jacobs published a study financed by the CEFC:
Benefits of Transmission Upgrades in a Transforming Electricity Sector
This study looked at the transmission implication of three separate studies Jacobs had previously done for the Climate Change Authority, the Energy Networks Association and the Climate Institute.
We quote somewhat liberally from the Jacobs report:
“First, they all examined scenarios where substantial emission reductions were required by 2030 ranging from 28% reduction to more than 45% reduction from current levels.
Second, the studies examined a variety of policies to meet the target but under all policies there was a requirement to retire a high proportion of the existing coal fleet by 2030.
Third, under most studies examined, interconnect upgrades played a material role in the transformed electricity sector.
Large amounts of interconnection were required over the study period, with up to 3,500 MW of additional interregional capacity over the whole NEM by 2030.
The faster the rate of closure of coal capacity the sooner the interconnect upgrades were required. Under most emission targets examined, a second link between Victoria and Tasmania was required by 2025
In all studies, there was marked change in the generation mix by 2030:
- For the 28% target scenario in the ENA study, coal generation in the NEM fell from 155 TWh to 82 TWh to 100 TWh. Gas-fired generation increased from 20 TWh to 76 to 93 TWh in 2030 and renewable energy generation increased from 55 TWh to around 80 TWh. Brown coal generation in Victoria reduced by over half.
- For the 48% target scenario in the ENA study, coal generation fell from around 155 TWh in 2020 to 39 TWh to 54 TWh in 2030. Only one brown coal power station remained in operation by 2030. Although gas generation increased, renewable generation had the largest increase, going from 55 TWh in 2020 to 99 TWh to 120 TWh in 2030 requiring substantial increases in renewable energy resources across all regions.
- For the two degree scenarios in the CCA study, the entire brown coal fleet was retired by 2025 and the black coal fleet in the NEM was retired by 2031. For Victoria, this meant replacing over 55 TWh of brown coal generation with other forms of generation in less than 5 years. Although additional black coal and gasfired generation played a role, the study found that renewable energy played a significant role in this replacement.
- Similarly in the TCI study, which examined mixes of policy approaches to reduce emissions, the brown coal generation in Victoria fell within a decade, with Yallourn closing before 2025 and Loy Yang A/B commencing closing before 2030 under the policy scenarios with a mixture of regulated closures of coal plant (by age), higher renewable targets or suboptimal carbon prices. Higher gas prices were assumed in this study than for the ENA studies and so more renewable generation was need to replace the brown coal generation.
- The studies found that significant interconnection upgrades were required. The extent of the upgrades was as follows:
- In the CCA study, the level of required upgrades ranged from 3,500 MW to around 7,000 MW with higher upgrades required for the higher the level of renewable generation. Around half of the upgrades were required by 2030, reflecting the severe reduction in coal fired generation in that period.
- In the ENA studies, only around 1,000 MW of upgrades were required in the period to 2030 for the 28% target. Around 1,750 MW of upgrades were required for the 45% target scenario.
- In the TCI studies around 2,200 MW of upgrades were required to the period to 2030 in the scenarios were there was a mix of policies to achieve the emission target.
The order of upgrades was consistent across the studies. In all studies examined, a doubling of the import /export capacity from Tasmania was required by 2025. Upgrades to the Queensland/NSW and the South Australia/Victoria interconnects were also required by 2030.
The principle reasons for this were the low cost of the renewable resources in Tasmania and South Australia, and the exhaustion through development of the available low-cost wind resources in Victoria in particular.”
ERCOT TX Competitive Renewable Transmission Zones [CREZ]
(based in part on 2014 Quarennial task force presentation and Wind association presentataion on CREZ to Californian conference)
In Texas, ERCOT realised that the potential of wind in the State couldn’t be realised without a more integrated approach. As far back as 2008 wind was being curtailed.
The CREZ concept was developed over 2002-2004 and a law passed in 2005 with a final order in 2007. There was a CREZ transmission optimization study, and a wind integration study, which were put together with dispatch priority.
So the CREZ proactive approach like all good plans had three simple elements.
- Identify the “best” resource zones;
- Develop a transmission master plan;
- Begin building transmission to zones.
25 zones were identified and 10 selected as focus for further studies based on estimated potential capacity factors of 40% or higher for the best 2GW of development in that zone.
The transmission was developed over the following five years and by 2011 about 3600km of largely double circuit 345 Kv lines were developed at a budgeted US4.9 bn.
The actual cost as of 2014 to facilitate 18.5GW of new wind or other generation was around $US7 billion for 5700km (measured by easement) Some of the transmission was built by existing providers and some by new entrants. This let wind in Texas grow from around 2.8GW to an estimated 20.4GW in 2017.
Why was CREZ a success.
- World class wind, and load
- Few barriers to land development
- Combined economic development, development of in State energy resources and development of green energy
- Regulatory and planning processes moved forward in tandem
- Wind integration is facilitated by a large fleet of flexible natural gas and by system wide dispatch at 5 minute intervals.
ERCOT comments that CREZ planning and development required several industry leading technical studies;
- Reactive device optimisation
- Sub-synchronous interactions
- Stability studies.
Point is they built it and as a result are in excellent shape.
Finkel report picks up on ERCOT Model
Chapter 5 of the Finkel report dealt with system planning. It recommended
- By mid-2018, the Australian Energy Market Operator, supported by transmission network service providers and relevant stakeholders, should develop an integrated grid plan to facilitate the efficient development and connection of renewable energy zones across the National Electricity Market.
- By mid-2019, the Australian Energy Market Operator, in consultation with transmission network service providers and consistent with the integrated grid plan, should develop a list of potential priority projects in each region that governments could support if the market is unable to deliver the investment required to enable the development of renewable energy zones.
- The Australian Energy Market Commission should develop a rigorous framework to evaluate the priority projects, including guidance for governments on the combination of circumstances that would warrant a government intervention to facilitate speci c transmission investments.
- The COAG Energy Council, in consultation with the Energy Security Board, should review ways in which the Australian Energy Market Operator’s role in national transmission planning can be enhanced.
NSW
The historic and “desired” forecast capex of Transgrid is shown below.

The requested capex relates to the 2018-2023 period. Most of the proposed capex is maintenance with some for augmenting capacity in the Sydney region. No capex has been allowed for “contingent” projects.
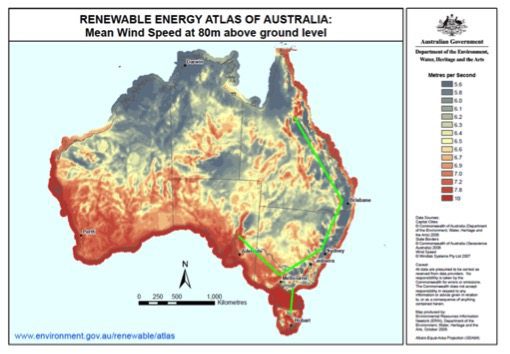
Yet there are more than 8GW of committed and proposed new renewables generation in NSW, some of which is indicated on the map below.

Transgrid have developed 5 contingent projects but don’t propose doing any of them until the trigger is reached.

Excluding the South Australia interconnect, we are only talking an upper end $1 billion to upgrade the NSW network in the North, South and South West to cope with much larger quantities of renewable capacity.
At a rough approximation this might add $1.30/MWh to customer bills before allowing for the downwards pressure caused by increased supply.
If COAG spent more time focusing on these basics and essentially declaring them as project worth doing, stuff the RIT test, then NSW, the epicentre of the NEM network could get transmission for more renewables progressed in short order.
In our view this is a typical example of where process is over emphasised relative to potential outcomes.
Victoria
The transmission system is owned and operated by Ausnet and has 6,500km with a 500kV backbone running from the Latrobe Valley to Heywood and a 220 kV ring around Melbourne. Victoria’s transmission system is more controlled by AEMO but essentially there are no firm plans that I am aware of beyond the Heywood upgrade for augmentation to allow more renewable connection. That’s despite the closure of Hazelwood and the construction (just completed or underway) of 1200MW of new wind and some PV, mostly in the West and Northwest of the State.
Queensland
Queensland has its “Powering North Queensland” plan, of which the key element is spending $150 million to upgrade transmission around Cairns and Townsville providing scope for 2GW of new renewables. Other than that, it is basic maintenance of the Queensland transmission network in its current state.
David Leitch is principal of ITK. He was formerly a Utility Analyst for leading investment banks over the past 30 years. The views expressed are his own. Please note our new section, Energy Markets, which will include analysis from Leitch on the energy markets and broader energy issues. And also note our live generation widget, and the APVI solar contribution.


