Taking a break from whats going on in Australia in this note I take a quick look at some global themes.
A summary is that solar is doing well across the world. Wind is struggling. Unfortunately, the European wind turbine manufacturers are unprofitable, wind farms take forever to permit in Europe and overall globally there seems to be only modest growth.
In this note I also glance at the June quarter financials of the world’s three largest wind turbine manufacturers, Vestas, General Electric and Goldwind and each of the three had a decline in sales. Only Goldwind showed an increase in orders.
By contrast two largely residential inverter companies, SolarEdge and Enphase, are doing very well. Enphase has absolutely shot the lights out. Both companies are seeing great rates of battery installations per solar installation in European households (80% attachment) and both are working heavily on the software side of things.
In utility battery land Fluence is unprofitable, but its orders are increasing. Tesla faces more demand than it can fulfil and its June quarter stationary battery installations were down.
Across the world social license is a big deal but nowhere more so than in Europe. Europeans may be cold this Winter due to lack of gas but they are stuffed if they want a new farm or transmission line in their patch.
IEA forecast reference
Although the IEA’s forecasts have, historically, rarely been that accurate, and indeed their PV capacity forecast became an industry meme, it may be that things will improve now that the IEA is more culturally disposed to get behind the decarbonisation theme.
In any event, for what its worth the IEA’s latest global forecast for solar and wind are shown below:

A good graph mostly bears some careful scrutiny and the graph above is the pictorial summary of a massive amount of information and analysis. Like a good sportsperson who makes, say, a great tennis shot look easy, or a great movie star making a performance seem so normal; so it is with a graph, the pinnacle of the analyst’s work boiled down, distilled and then delivered in a mouth watering drop of pure information.
What I take from this graph is:
First, that annual solar output is expected to virtually double over five years and this should contribute to pretty much a doubling of the global installed capacity and therefore maybe a 25% reduction in unit cost for solar panels in $US/w.
Second: the rest of the world is starting to get the behind the meter bug that Australia has and this will have lots of implications, including what a great opportunity for inverter manufaturers and software developers. Also lots of solar means lots of storage.
Third: Global wind is stagnating and this is not good enough. Based on cost and resource availability, wind arguably could be doing as well as solar. Offshore wind is still not really taking off in the IEA view. Again despite all the work the forecast is always a matter of judgement and nearly always tends to present an extrapolation of what actually happened last year.
Turning to the regions that are driving the investment the figures show it’s China, Europe and the USA that drive the growth in solar and, according to the IEA’s forecasts, it’s those same regions that show much less wind ambition. The chart shows the total capacity expected to be added in the five year forecast relative to what was achieved in the past five years.

According to the IEA, Asia ex China but including India might as well not exist in renewable energy ambition. It’s something of a disgrace that the leaders of India, Japan, South Korea, Vietnam, countries that stand to lose heavily from climate change, are expected to do so little. But I am not here to proselytise but rather to analyse.
China and Europe are a great contrast
China is at once by far the greatest contributor to global warming and also the largest builder of renewables. At the moment, though, the bad far, far outweighs the good.
By contrast Europe is moving definitively in the right direction but, as ever, it’s going too slowly.
Europe aiming for 40% renewables by 2030 – Australia 80%
To be clear, 40% renewables by 2030 although a doubling over 20% is no where near enough, 60% would be a better minimum. 60% would make all the EVs and broader carbon reduction strategies that much more meaningful. In addition, it would of course reduce reliance on gas and Russian gas in particular to a greater extent.
However the “Fit for 55” plan only calls for 40%. And Europe is more or less on track for 40% renewables by 2030.
Europe consumes 2.6 TWh per year of electricity and aims to double renewables share from 20% in 2020 to 40% in 2030.

To me this target appears quite achievable although it will be done at a higher cost than need be the case. Almost certainly a lower cost solution would use more wind but in Europe wind is difficult and solar appears easy.
So Dave’s solution has about 45% of the required new capacity coming in solar:

China is by far the world’s worst polluter
China is recklessly endangering the world by expanding coal production rapidly in the face of overwhelming evidence of the disaster it is bringing down on the world. Xi Jinping’s memory will live through history as the ruler that oversaw a gross expansion of coal
Since Xi became President of China in 2013, coal production has grown from a bit less than 3.5 bt per year to a recent annualised rate of 4.5 bt.

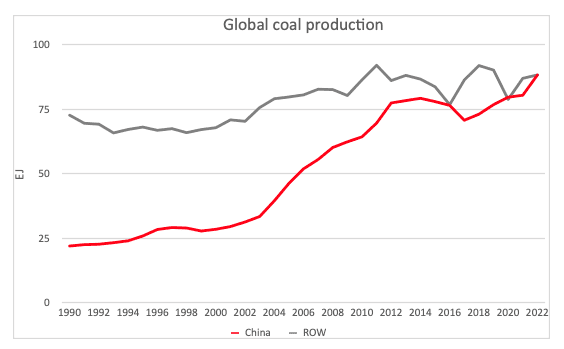
And China is building the power stations to burn the coal.
In the end, even though China is also installing more wind and solar than anyone else, the bad outweighs the good. China these days is the main factor limiting global decarbonisation.
Updates from wind and solar equipment manufacturers
It’s increasingly apparent that Russia cutting off gas supply to Europe is not leading to an immediate surge in wind farm development.
Indeed social license appears, perhaps unsurprisingly, to be an even bigger item in Europe than in Australia.

And as for transmission it probably takes longer still. It’s striking how much harder it is to get wind permitting done as compared to solar. In France its’ about 70 months to permit a wind; 6 years – never mind the financing, construction and commissioning. A solar farm can however be permitted in 40 months, still a long time but little more than half what the wind would take. In Spain, once a leader in wind, it now takes 85 months to permit a wind farm.
The problem is bigger than that. Wind Europe states that:
“Europe’s 5 wind turbine manufacturers are operating at a loss “
And because they are operating at a loss they are more interested in raising prices than getting new orders.
Each of the three largest global wind turbine manufacturers had declining sales. Two had falling orders
Vestas, possibly no longer the world’s biggest turbine manufacturer, saw its new orders collapse in the June quarter:

And its gross profit has collapsed. I don’t show cash flow but that is also very negative even at the operating level.

General Electric [GE] plans to spin off its turbine business, gas and wind into “GE Vernova”. You have to wonder how much money the branding people were paid to come up with “Vernova”
Vernova’s orders and sales were also down year on year for what is probably one of the world’s top 3 turbine manufacturers:

On the other hand, in a rare bit of good news for the wind industry, Goldwind has sailed ahead at least in terms of orders. However sales value declined as did gross profit and Goldwind in the normal Chinese fashion continued to have an operational cash outflow.

According to the Goldwind presentation, China installed 13GW of wind in the half up 19% on PCP and taking the total to 342GW. Wind provided 9% of China’s electricity in the half (compared to Australia at about 14-15%). The average utilisation was 1156 (capacity factor just 26% ie not much better than Europe and curtailment was just 4%).
PPA prices in China (based on capacity not energy) have risen in the past 12 months. Every industry has a map and this is the China clean energy map. Like coal doesn’t exist. Also of interest in the map is that the only wind and solar in the South, heavily industrialised, heavily populated area of China is offshore wind.

Solar
Solaredge sales increased and spoke optimistically about the growth in Europe. They also noted that in Germany solar sales tend to result in home battery sales. The talk to an “attachment rate” of 80% on their old product.
Generally in Europe home battery sales per solar installation are much stronger than they are in either the USA or Australia. To me this shows that policy in Australia just isn’t right. It shouldn’t be that way.

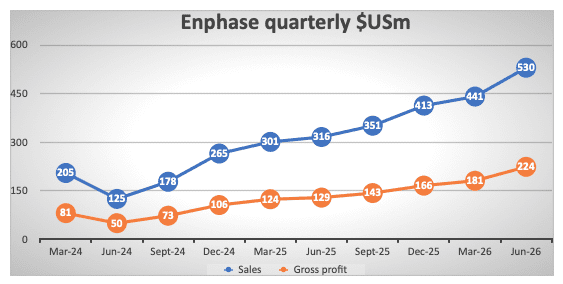
Enphase – the easy winner in manufacturing
Enphase was nearly broke a few years ago. Its share price was down around US$1 in 2018 but in 2022 its over US$300 and possibly has something more to give.

The transformation was driven by what seems to be a brilliant new CEO. Here is an example of his commentary from the Q2 results call:
“In Europe, the revenue increased 69% sequentially and 89% year-on-year, led by strong demand for our microinverters in Netherlands, France, Germany, Belgium, Spain, and Portugal. We are starting to see good demand for our IQ Batteries in Germany. Homeowners want self-consumption as the region, not only faces energy prices that are rising, but also a growing demand for home electrification driven both by electric vehicles proliferation as well as natural gas shortages.
We plan to introduce IQ Batteries into a few more European countries later in the year. We also expect to ship our IQ8 family of microinverters into Netherlands and France later this year. Sector coupling is the latest buzzword in Germany, and it denotes the integration of three sectors: the heating and cooling sector, the transport and mobility sector, along with the power producing renewable sector.”
From the investor call Q&A:
“On Germany, it’s fascinating. We were quite small in Germany, let me say that first. But the German market is a big market. The last I heard is it’s roughly 2 gigawatts residential TAM, I’m talking solar. And I’m getting 80% attach, so 2 gigawatts times 80% is 1.6 gigawatt hours of batteries….And every installation is accompanied – every solar installation is accompanied by a battery, by a EV charger, which is virtually free, you get rebates, and then normally, heat pumps as well. So they require us to basically work with thirdparty EV chargers, third-party heat pumps, which we are working very hard to have that capability and we expect to have that shortly.”
Battery suppliers – Fluence is still struggling
Fluence has only been a listed company for a bit over 12 months and its share price has halved from IPO but its also well up from the low point so investors presently think things will get better. The main problem for the company is its gross profit is about zero and so after taking into account operating expenses it runs at a loss. So the product price needs to increase or costs be reduced sharply.
Nevertheless even though new orders were down in the quarter compared to PCP they are well up for the 9 month total.

Tesla saw its Q2 deployments fall 11% to 1.1 GWh “mainly due to semi conductor challenges…. Demand for our storage products remains in excess of our ability to supply”
Social license
As noted social license is a big deal in Europe, the biggest roadblock to faster decarbonsiation.
Its also becoming an issue in the USA. The link below to an article in the New York Times is headlined as being about the invasion of Ukraine but is actually mostly about the social license issues of transmission in the USA.
Ukraine to electricity transmission in USA
“But the most important factor for quickly expanding our exploitation of oil, gas, solar, wind, geothermal, hydro or nuclear energy is giving the companies that pursue them (and the banks that fund them) the regulatory certainty that if they invest billions, the government will help them to quickly build the transmission lines and pipelines to get their energy to market.
Greens love solar panels but hate transmission lines. Good luck saving the planet with that approach.”
I can think of prominent Greens in Australia who fall in the same camp.
I’d therefore, as member of the Sydney committee of the AIE likely to draw attention for our Sydney residents of a forthcoming discussion on social license in Australia.