This note sets out some headlines and analysis of ITK’s updated price forecasts for the National Electricity Market (NEM), which are based on a continuation – at least in the short term – of the recent themes that have dominated the market.
These are:
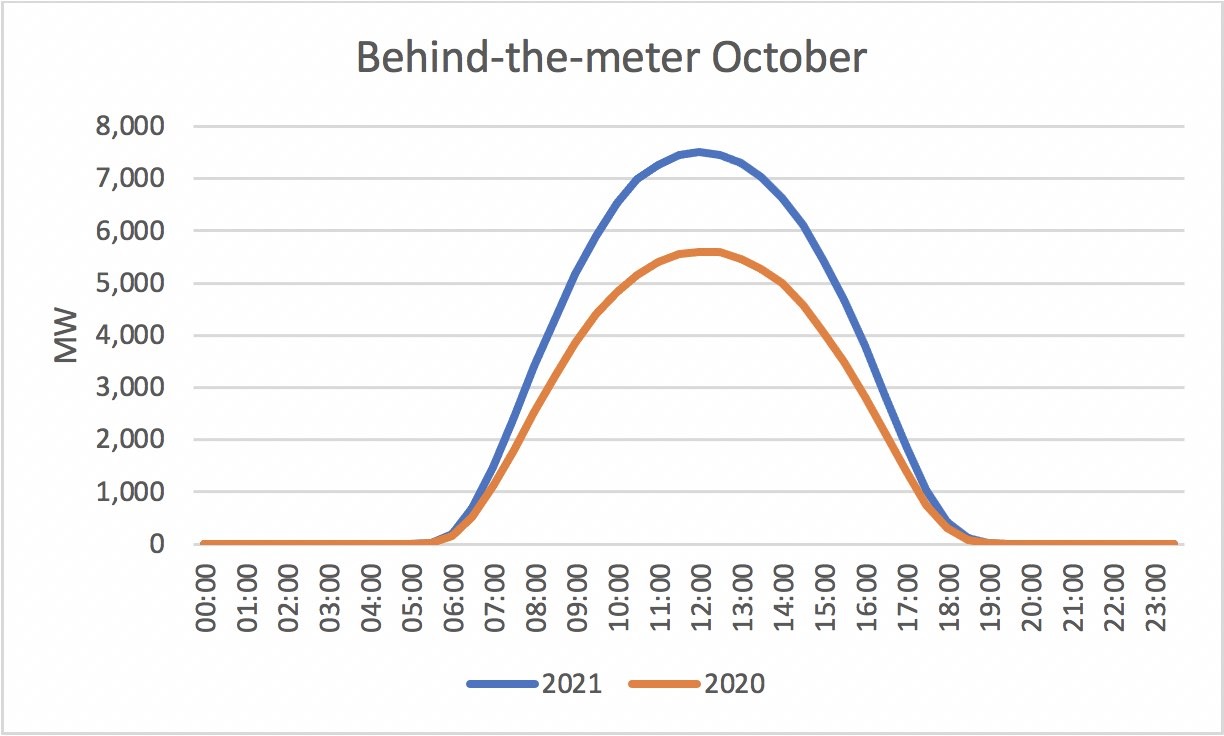
The ongoing rooftop solar penetration and the driving of midday prices towards zero in spring, which still provides more pricing power to thermal generation in winter.
An expectation that higher solar penetration of all sorts will somewhat mitigate traditional January and February price risk, notwithstanding the normally low wind speed and wind generation performance during really hot weather.
The below “equilibrium” pricing outlook is also driven by approximately 6GW of extra VRE (variable renewable energy) that is either yet to be fully commissioned, still under construction, or committed but not yet started construction.
Most of that capacity is in Queensland and NSW, and the biggest part (almost 50%) is in the very early stage, i.e. committed, and therefore won’t impact prices for a couple of years.
Even so, in total we see that new generation as contributing a further 18TWh, or close to 10% of NEM supply, and yet operational demand will, at best, show no more than 1% growth per year. So this, too, will put pricing pressure on all participants.
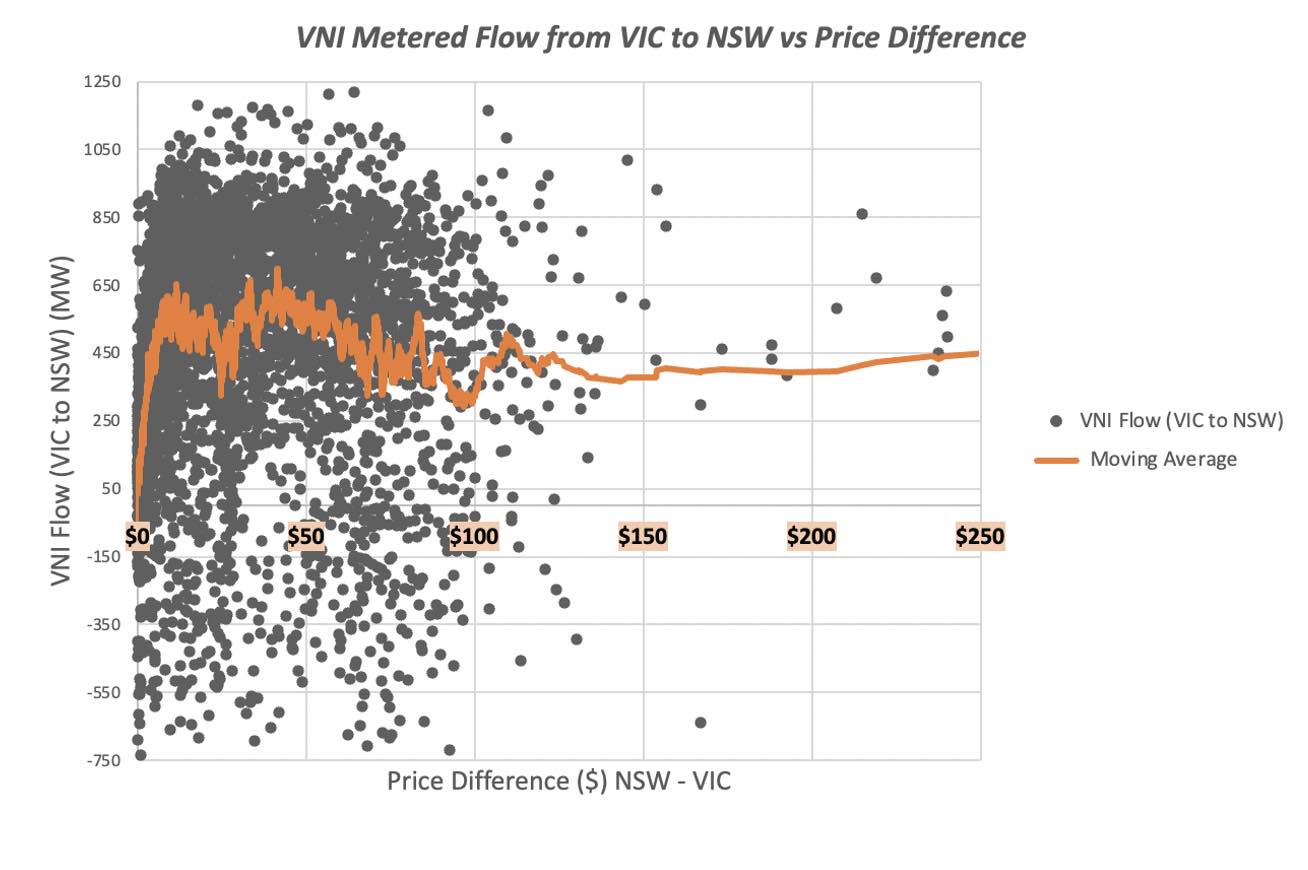
Near term inter state transmission issues also remain, and this has lead to sharp differentials between NSW and Victorian prices and to a lesser extent between QLD and NSW. NSW consumers and Victorian and South Australian generators are the losers near term.
Although thermal fuel prices, particularly coal ,are ridiculously high, we have only modestly moved up our NSW coal price assumption based on a view that new contracts will be of short duration (higher prices), but reflect incremental mining costs and the high ash, lower cost coal for which the generators were designed.
We expect thermal generators to operate in a more “campaign mode”, and we can already see pronounced daily thermal ramps in NSW, and these will get worse. As more batteries enter the system the competition for the remaining revenue pool when solar is not operating will start to intensify.
Batteries are incentivised probably more by the low midday prices than the high evening peaks, but in general if you were to unrealistically assume perfect foresight and that new supply has no impact on price, then there is enough margin to justify batteries – even if time shifting was the only revenue stream.
And this is the key point: Even if the near term situation is unfavourable, prices are inherently self correcting.
That said, beyond the near term the obvious driver is supply procured by the NSW road map, including the 2GW of medium duration storage.
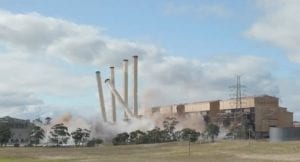
That supply, together with Snowy 2.0 when it eventually arrives and the two new gas plants in NSW, will lead to even more competition in the “power” market, probably contributing to early closure of more supply, and not just in NSW.
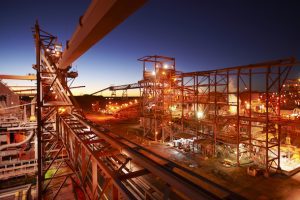
Rio Tinto’s decision to pursue carbon light supply to its QLD and NSW aluminium smelters is at once good news in terms of higher electricity demand but equally bad news for some thermal power stations, particularly Gladstone.
It’s likely that the closure of Gladstone, which ITK expects a little before 2030, will unlock substantial transmission access in central and North Queensland.
Below we show a few charts from our update. Clients get dashbords with detailed quarterly and annual flat, peak, solar DWA (dispatch weighted average) and wind DWA prices, along with detailed new supply estimates by developer, stage of construction, fuel and region.
We show average daily demand, price and supply by fuel based on a merit order model. We do not do sample demand for weather, nor do we forecast individual station output, nor forced unavailblity.
Pricing power of thermal generation is measured by cost gap from one fuel to the next and with the broad extent of competition within a fuel driving the amount of headroom we assume can be attained.
These parameters are regularly reassessed to reflect observed but inconsistent behavioural patterns. So called animal spirits or the lack of them and that from time to time parts of the industry may be trying assert leadership and at other times not.
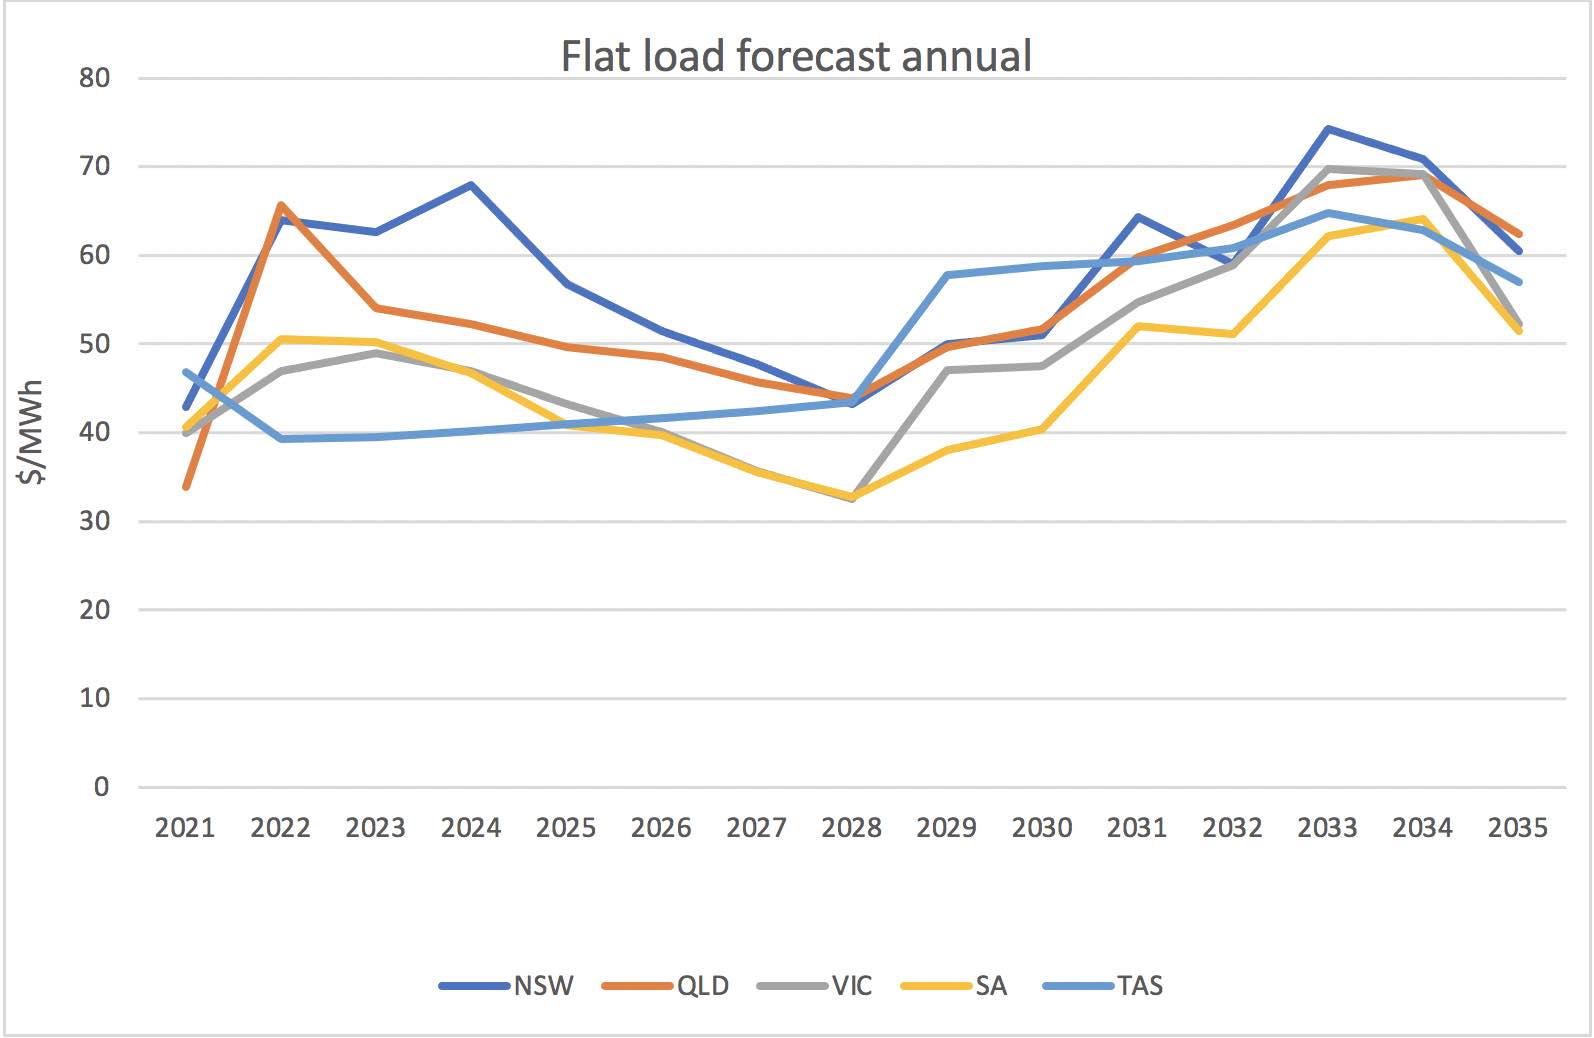


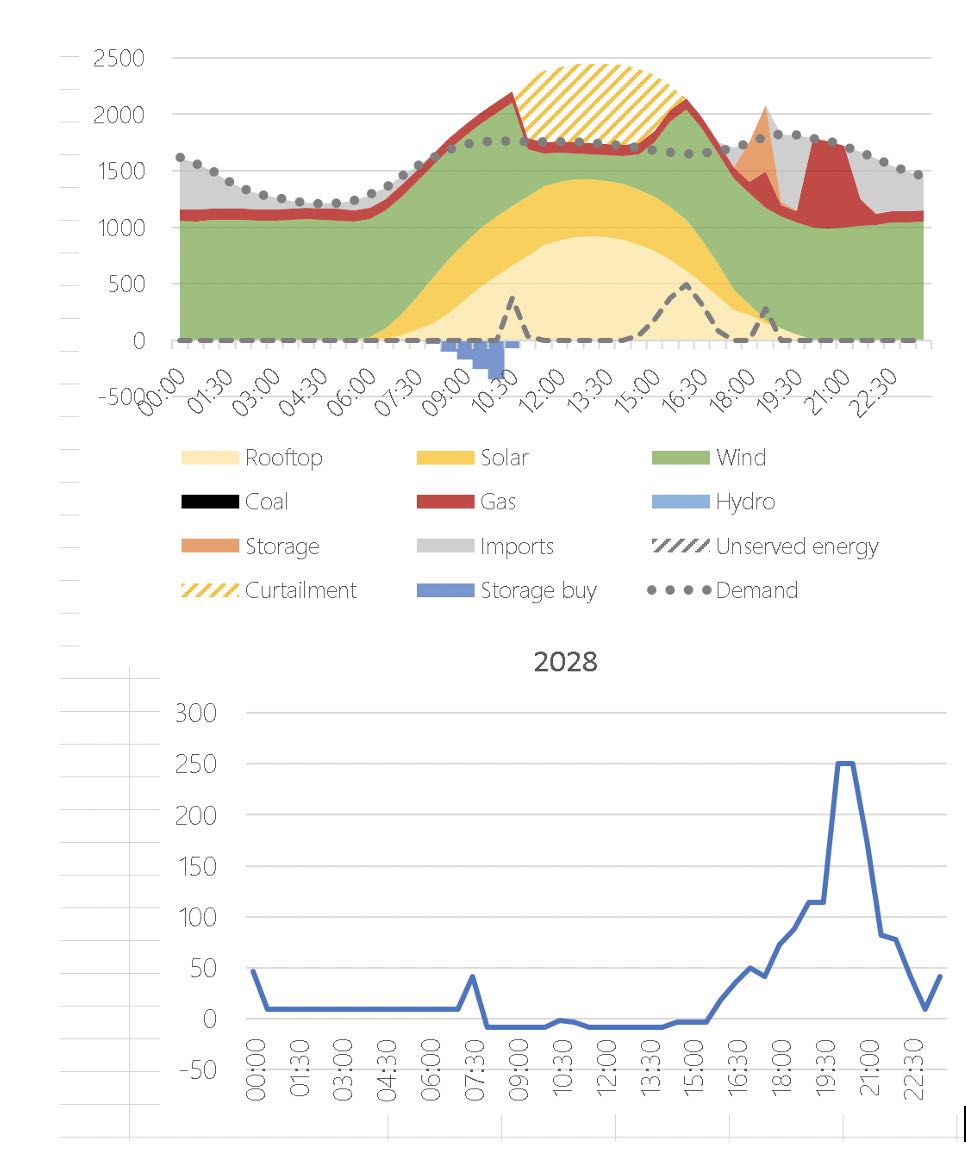
4. SA 2028 profile, price in the lower panel. Source: ITK