Australia’s decision to approve the extension of Woodside’s North West Shelf LNG facility through to 2070 is a defining moment in the nation’s industrial and climate legacy, and not in a good way.
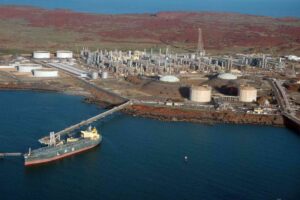
This new infrastructure has implications far beyond just the shoreline of the Burrup Peninsula. The scale of energy loss and emissions associated with today’s LNG supply chain makes it clear that continuing to invest in long-lived fossil fuel projects is fundamentally at odds with Australia’s climate and industrial aspirations.

Caption: Sankey diagram of energy losses in petajoules along the Woodside LNG supply chain by author
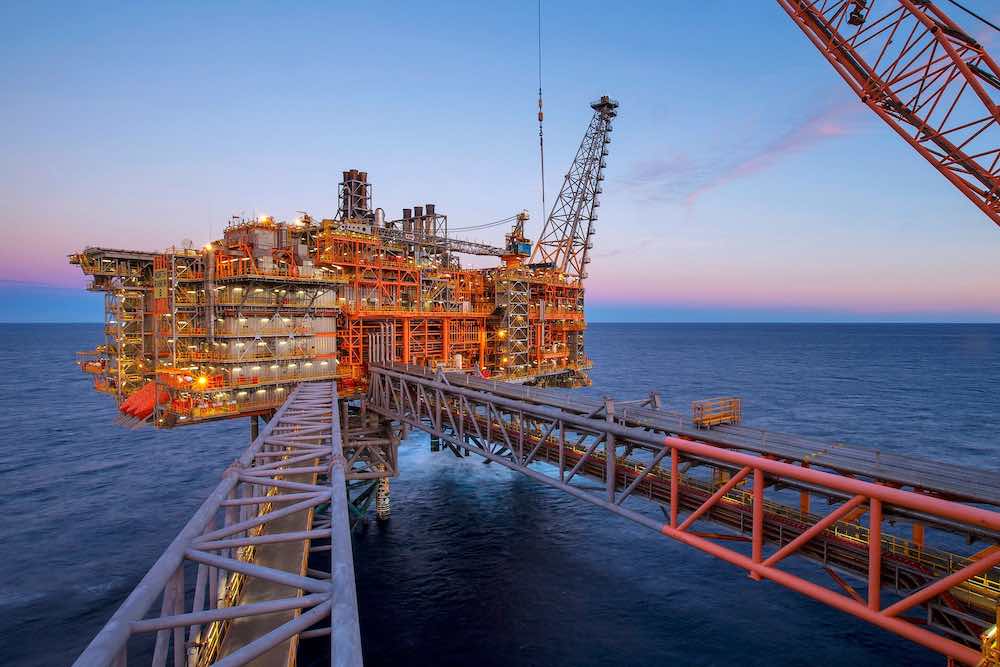
Each phase of this supply chain bleeds significant amounts of energy. The initial extraction of gas from offshore platforms is only partially efficient, with routine flaring, methane venting, and continuous fuel consumption in platform turbines already reducing the available energy considerably.
The compressors and turbines offshore consume substantial portions of the gas itself, diminishing what can be delivered to shore. Even before reaching the pipeline, several percentage points of the initial primary energy content of the gas have been irretrievably lost.
Pipeline transmission compounds these losses. Compressors maintain high pressures necessary to transport gas hundreds of kilometers from offshore platforms to the liquefaction facilities at Karratha.
These compressors, powered by burning portions of the very gas they transport, create another round of inefficiency. By the time natural gas reaches the LNG plant gates, additional energy has dissipated as waste heat into the atmosphere.
At the liquefaction plant itself, energy losses become even more pronounced. Cooling natural gas down to approximately minus 161° Celsius, the temperature at which it liquefies, is an inherently energy-intensive process. Massive compressors driven by gas-fired turbines run continuously to chill and liquefy gas, releasing huge amounts of low-grade heat.
This stage alone typically consumes around 10% to 15% of the gas arriving at the plant, transforming useful primary energy into unusable waste heat. In thermodynamic terms, liquefaction effectively ensures that no more than about 85% to 90% of the gas’s original energy content ever makes it to market.
LNG tankers don’t run on diesel but instead burn a portion of their LNG cargo, including unavoidable boil-off methane, to fuel their engines. LNG must remain at cryogenic temperatures during transit, and some inevitably vaporises into methane gas. Rather than venting this methane directly, an environmental disaster, it is captured and burned in the ship’s propulsion engines.
While better than venting methane directly, this approach nevertheless translates to further energy losses, as a portion of the cargo is permanently consumed just to get the rest of the LNG to its destination. While the ship operator might consider this an energy service, it’s best characterized as rejected energy.
Once LNG arrives at its destination, additional energy is consumed at regasification terminals. These facilities reheat the LNG to gaseous form, typically through heat exchangers using seawater or, in some cases, burning more fossil fuel. This step adds another incremental energy loss to the overall chain.
Ultimately, the delivered gas, already significantly reduced from its original primary energy content, is burned at a power plant or industrial facility, itself never converting more than around 50% to 60% of the remaining energy into usable electricity or heat.
LNG is so expensive that it’s the fuel of last resort, so it’s better to think of it as burned half in peaker plants, which are much less efficient than combined cycle gas turbines, hence the reason I used 40% for the Sankey diagram.
The cumulative effect of these sequential losses means that from initial extraction to final use, only a third of the energy originally extracted from offshore fields is converted into genuinely useful electricity. Most of the initial primary energy content disappears as waste heat into the atmosphere at every stage along this lengthy, inefficient supply chain.
This extensive chain of energy losses illustrates the primary energy fallacy, where initial gross energy quantities obscure the profound inefficiencies involved in fossil-fuel supply chains.
Energy policy often misleadingly emphasises the total energy extracted or produced at the source rather than recognizing that most of this primary energy vanishes long before consumers can benefit.
The extension of Woodside’s facility will perpetuate precisely this type of fundamentally inefficient fossil fuel infrastructure, locking Australia and its trading partners into decades of unnecessary emissions and wasted energy.

Caption: Stacked Sankey diagram of CO2e emissions in kilotons along the Woodside LNG supply chain by author
These energy inefficiencies are tightly linked to greenhouse gas emissions. Extraction alone generates an estimated 3.0 million tons of CO₂ plus methane leakage equivalent to 7.1 million tons of CO₂-equivalent every year. Pipeline transmission emits another 1.2 million tons of CO₂ and around 0.8 million tons CO₂-equivalent from continuing leaks.
Liquefaction at Karratha causes roughly 5.8 million tons of CO₂ plus 0.6 million tons in methane CO₂-equivalent. LNG shipping adds approximately 2.8 million tons of CO₂ and an additional 0.15 million tons from methane, while regasification contributes about 0.35 million tons of CO₂ and a further 0.04 million tons of methane-CO₂.
Finally, combustion in power plants at destination emits a massive 64.4 million tons of CO₂ and around 0.65 million tons of methane-CO₂-equivalent annually.
When combined, these stages release approximately 87 million tons of CO₂-equivalent every year from a single LNG supply chain.
To put that in national perspective, Australia’s domestic transport sector emitted roughly 106 million tons of CO₂-equivalent in 2022–23, primarily from passenger vehicles but also from trucks and aviation. Transport is Australia’s third-largest emissions source, accounting for around 18 per cent of total emissions. The LNG chain that Australia has approved rivals it in scale.
Further context from national emission reporting shows total Australian greenhouse gas emissions reached around 440 million tons CO₂-equivalent in 2023–24, with transport comprising a quarter.
Stationary energy, feeding coal plants, gas plants, manufacturing, and buildings, accounted for about 86 million tons. The Woodside LNG supply chain alone creates emissions comparable to each of transport and stationary energy. That reality exposes how deeply embedded fossil fuel dependence remains in Australia’s geopolitical and economic thinking.
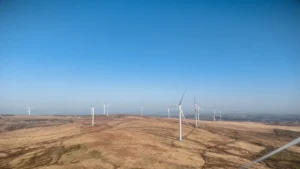
Australia’s public narrative paints progress with wind turbines and solar panels, but while the electrical system decarbonises, export volumes continue to rise on the back of their emissions legacy. The transport sector is only starting to show signs of flattening and will need a decade of very strong policy to decarbonise significantly.
Meanwhile, new fossil fuel infrastructure proliferates with extensions and pipelines. The current trajectory locks in emissions that will dwarf everything Australia achieves on shore.
This is not theoretical. Every petajoule of gas flowing through LNG infrastructure today carries an embedded climate cost that hasn’t been counted in the budget.
By extending Woodside’s NWS facility another 45 years, Australia is underwriting an emissions future rivalled only by the entire transport system. That is a sobering fact no one should ignore, and one that will define how effective the nation’s net zero goals actually are.