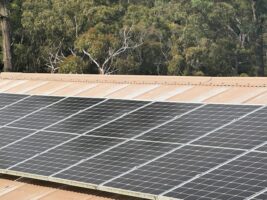
Solar PV and wind
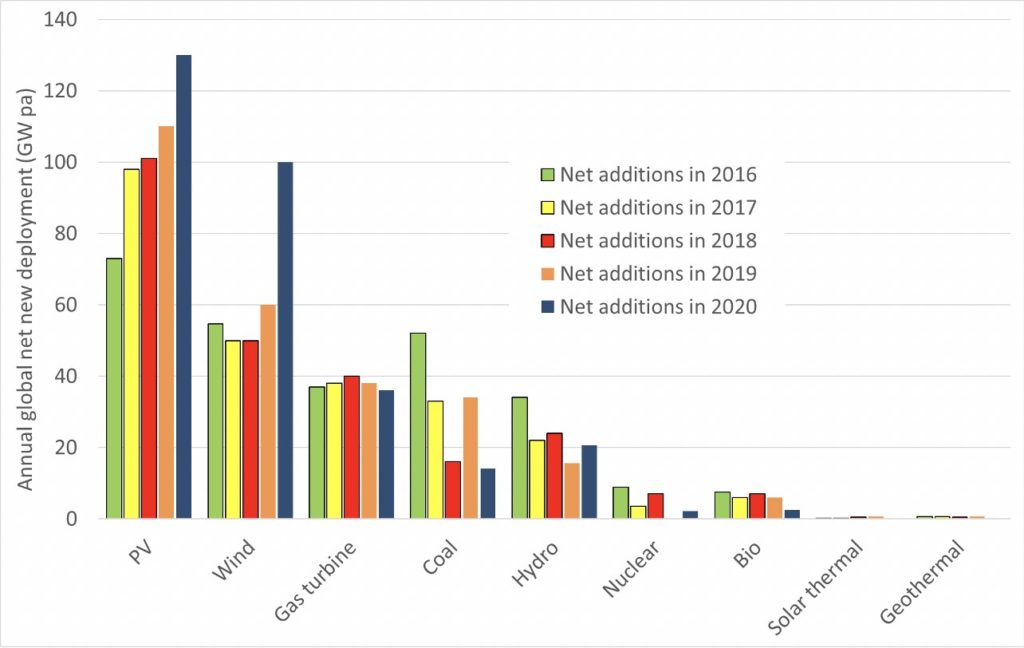
Arguably, the fastest change in global energy systems in history is underway. In 2020, new solar photovoltaics (PV) and wind capacity comprised 75% of global net new generation capacity (Figure 1) according to the International Renewable Energy Agency.
New PV and wind capacity was 10 times larger than net new hydro and coal capacity and 100 times larger than net new nuclear, carbon capture & storage, bioenergy, geothermal, solar thermal and ocean energy generation capacity.
Extravagant deployment growth rates are required for other low-emission technologies to catch PV and wind.
PV and wind generators are derived from vast production runs and produce cheap electricity.
The International Energy Agency recently declared that “For projects with low cost financing that tap high quality resources, solar PV is now the cheapest source of electricity in history”.
The global solar and wind energy resource is vastly larger than global energy requirements.
Global PV and wind leaders
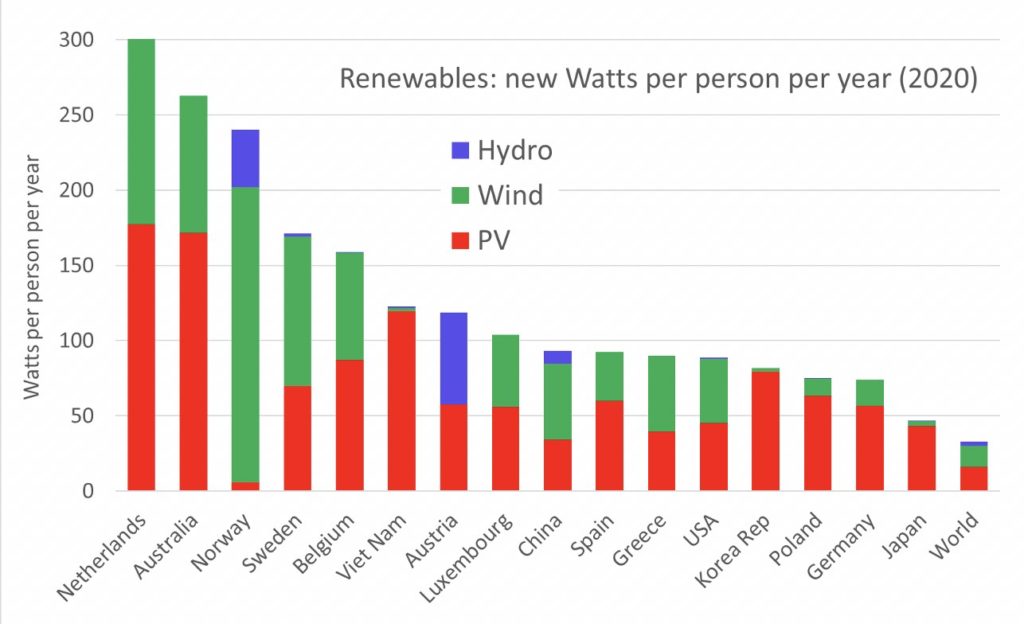
The global per capita leaders in deployment of new renewable generation capacity in 2020 were the Netherlands, Australia and Norway (figure 2). They deployed new renewables per capita at 10 times the global rate and 3 times faster than China and the USA.
Australia has the most installed solar PV capacity per capita, ahead of Germany, the Netherlands, Japan and Belgium.
Since the Australian solar resource in the populated southeast is 30-50% better than in those countries, Australia is by far the leading country in terms of per capita solar generation and also solar deployment speed.
In respect of deployment of wind capacity, Australia is in 4th and 13th places for deployment speed (Watts per person per year) and total deployment (Watts per person) respectively. Eleven European countries and Uruguay rank ahead of Australia for the latter.
Greenhouse mitigation
The rapid rise to dominance of PV and wind in generation capacity construction has immense implications for greenhouse emissions trajectories through displacement of fossil fuels (which cause three quarters of global emissions).
PV and wind can readily decarbonize electricity systems. Electrification of most land transport (via electric vehicles) and heating (via electric heat pumps and electric furnaces) is relatively straightforward using existing widely-deployed technology.
A recent paper shows that electricity production in Australia needs to double to decarbonise these sectors. This would eliminate 69% of emissions without significant impact on electricity prices.
To accomplish this task by 2040, the deployment rate of PV and wind would need to double from 7 GW in 2020 to 14 GW per year, which is not so hard considering that the deployment rate in 2015 was only 1 GW per year.
The balance of emissions comprises fugitive emissions (10%) (which vanishes as fossil fuel use vanishes); waste (3%); chemical production, aviation & shipping (8%); and the land sector (10%).
Grid balancing
Balancing high levels of variable PV and wind is usually straightforward through storage and strong interconnection between regions (to smooth out local weather).
Rapid deployment of PV and wind in Australia and Vietnam is notable because neither country has significant grid connection to neighbours to help balance the grid.
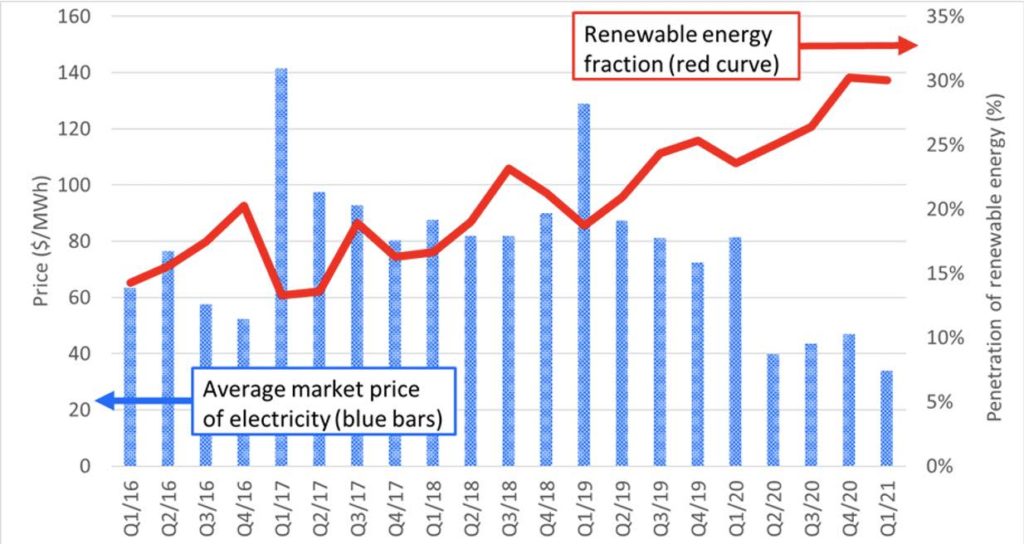
According to estimates from the Clean Energy Regulator, 7 Gigawatts of new solar and wind energy capacity was added in 2020.
As a consequence, renewable electricity reached 30% in the National Electricity Market and 70% in South Australia over last summer and is tracking towards 45% and 100% respectively in 2024.
The current (2021) and market futures (2024) spot price for electricity in the NEM and South Australia is $40/MWh, which suggests that the balancing cost of high levels of PV and wind is low.
Pumped hydro energy storage comprises 95% of global storage power and 99% of global storage energy. It provides lowest cost storage for periods of more than a few hours.
The global pumped hydro storage atlas lists 616,000 sites(4,000 in Australia) with 23 million Gigawatt-hours (GWh) of combined storage, which is two orders of magnitude more than required to support a global 100% renewable electricity system.
In Australia, two pumped hydro systems are under construction (Snowy 2.0 and Kidston) with combined storage power and energy of 2.3 GW and 350 GWh respectively.
Batteries (utility, home and in electric vehicles) complement pumped hydro by providing short term storage. About 2 GW (2 GWh) of utility batteries are under development in Australia.
The renewable energy industry in Australia is now worth $11 Billion per year (including both rooftop and utility solar and wind systems) and is employing 27,000 people.
Continuing reductions in the price of solar and wind may cause a wave of early coal generator retirements during the 2020s, further accelerating the change towards a renewable grid.
Professor Andrew Blakers is head of the Research School of Electrical, Energy and Materials Engineering
at Australian National University