The growing share of rooftop solar in Western Australia is not just pushing the summer peak well into the evening, it is removing them entirely – so much so that this past summer the peak was no greater than in winter.
The Australian Energy Market Operator reveals – in yet another nugget from its Quarterly Energy Dynamics report – that in the past summer peak demand reached 3,253MW. Not only was this well below the record peak of 4,006MW, it was also just 2MW bigger than the previous winter peak.
“This was driven by the comparatively mild summer conditions and increased penetration of rooftop PV,” AEMO says in its report. “In addition, the summer peak continued a trend of occurring later in the day.”
This graph below shows the trend – the difference between the “hot season” peaks and the winter peaks, once significant, has narrowed over the past decade. The big increase in rooftop PV has occurred in the last three years.

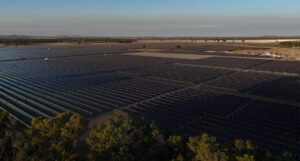
Western Australia now has some 1.125GW of rooftop solar, and a growing share of renewables, with the recently completed 130MW Badgingarra wind farm joining the local grid .
As the summer peaks fall down, minimum down is also reducing, and may even disappear altogether on mild days with lots of sun – which is adding more challenges for AEMO in the WA market, and has forced it to impose directions – known here as the load following market – for the first time late last year.
The share of renewables is reflected in AEMO’s comment that at 1145 on Sunday, February 3 this year, the share of renewables in the local grid – known as the South West Interconnected System – peaked at a record 47.8 per cent.
 Sharp-eyed local energy executives last week told RenewEconomy that they thought that the share of renewables had in fact exceeded 50 per cent for the first time, on Good Friday, April 19, relying on AEMO and APVI data gleaned from their public dashboards (See table above).
AEMO insists that February 3 was a slightly higher share of renewables, or what it calls “non scheduled generation” (or NSG) and that on April 19 the share was just 46.3 per cent.
It explains the difference between the figures visible on the various public “dashboards,” including its own, as that between “sent out” energy, and total generation including internal consumption by the thermal generators, also known as “auxiliary” load, which can only be viewed through internal AEMO data.

That being said, most of the milestones recorded in Australia and overseas, are based on “sent out” data, because that is what is visible to the public.
No matter, the trend is clear and the share of renewables will continue to grow. “This trend of increasing NSG as a percentage of underlying demand is expected to continue as more NSG facilities register in the WEM and increasing capacity of rooftop PV is installed,” AEMO says.