Large-scale Generation Certificate (LGCs)

Along with some positive price signs in the front end of the LGC curve, April was notable for the emergence of a number of innovative financial products aimed at assisting the deployment of renewable energy across the National Energy Market.
Trade activity in the LGC market increased during April, though still remained fairly low by recent standards. Across the month the spot enjoyed the most significant price movement, while the Cal 19 forward contract saw the highest trade volumes.
Having opened the month at $84.10, the spot LGC market softened across the first half of the month to reach a low of $83.60 before a prompt about face which would see the market up to a 10 week high of $86.00.
The level however could not be maintained and by month’s end the market was back at $84.75, a 1% increase on the previous month’s close.

The Cal 18 vintage opened the month in the high $85s and reached a high of $87.30 in the latter part of the month before losing ground alongside the spot.
By far the most liquid of the LGC contracts across April, the Cal 19 market traded actively between $76.40 and $77.85, ultimately closing in the mid $77s.
The Cal 19 vintage continues to trade at a discount to the Cal 18s, despite it being the period in which most of those who are anticipating an LGC shortfall believe it will eventuate.
In part this likely reflects the fact that time brings uncertainty and hence broadens the potential range of outcomes.
In the Cal 20 market which perhaps remains the most controversial, the market opened at $34.00 before softening to $32.75. Like the rest of the market it enjoyed a bounce in the second half of the month which saw it reach a high of $36.00 before ultimately losing ground to close at $33.00.
The significant discount to the earlier vintage appears to reflect the additional time that an extra year provides the market to complete projects and thus ensure a surplus of LGCs exists for 2020 compliance.
Indeed, as previously noted, the Clean Energy Regulator is confident that this will be the case. According to the CER a total of 6000MW of new projects were required to be committed by the end of 2018 in order to ensure the target is met.
According to its numbers over 4500MW has already been locked in, with an additional 1500MW still required. As stated previously, the CER firmly believes the remaining requirement will be met with sufficient credible, developed projects waiting in the wings.
There are of course those in the market, call them pessimists or realists, who continue to believe that in the energy infrastructure development space things are rarely delivered on time, be it due to approval processes, construction times or other factors. Hence the development pipeline remains a keenly observed data set for the forward LGC market.
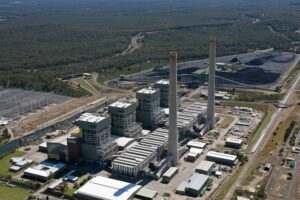
Like many industries across the globe, electricity generation is undergoing a transition resulting from technological advances and environmental imperatives.
Such transitions are rarely smooth and can often be slow to commence.
Well over a decade into that transition such changes are increasingly manifest in the National Electricity Market in terms of the growing proportion of renewable energy generation, the reduction in base load fossil fuel generation and the changes in wholesale market pricing which have resulted.
In April a major milestone was reached with the transaction of the first firm solar shape contract set against the Victorian node. The transaction represents an averaged solar export profile with each megawatt hour accompanied by a stapled LGC, with the product intending to represent a bundled solar structure.
Markets also now exist for the inverse solar shape, also referred to as a solar firming product which aims to firm the output of an average solar project to fill out the profile to a flat swap.
Along with being an important development for project proponents, these innovative financial instruments are also valuable for the introduction of new corporate buyers that are looking to contract directly with renewable energy projects in order to take advantage of the cost reductions such projects offer.
Based on the current shape of the – albeit still opaque – National Energy Guarantee, it appears that alongside state based renewable energy schemes, the growth of direct corporate contracting will be required in order to continue to drive renewable energy uptake beyond 2020.
Small-scale Technology Certificates (STCs)

With the release of the 2018 Small-scale Technology Percentage in late March and Q1 compliance due by late April, a wave of buying interest helped buoy STC prices across April, while public holidays also impacted on STC submissions. The real test for the STC price will likely come during May.
The release of the 2018 Small-scale Technology Percentage (STP) had already assisted spot STC prices immediately after its release.
Across the first three weeks of April it ensured prices remained high with buyers having less than a month to acquire any outstanding requirements for Q1 compliance which was due by 28thApril.
It appears many liable parties had been quite conservative in their approach to Q1 compliance with the buy volume continuing to flow into the second half of the month.
Having reached a mid month high of $39.35, the spot softened gradually back to the high $38s across most of the remainder of April, finally losing ground in its final days.

The strength of pricing may also have been impacted by a reduction in the weekly submission volumes which – with 3 public holiday affected weeks out of 4 across April – were clearly below that which was observed across February and March.
At a four week average of 460k, STC submissions remained comfortably above the 425k required for the target. Yet these numbers are going to be keenly observed over the coming weeks for several reasons.
On the one hand, the absence of a constant stream of public holidays will allow installs and processors to get back up to full speed, thus potentially revealing whether there has been a slowdown in sales in recent times or if in fact the reduction in working days has been to blame.
On the other hand, May will mark the beginning of the winter months which typically see a reduction in sales, installation activity and therefore STC supply.
In 2017 there was no reduction during this period. What happens in 2018 will likely determine whether STC prices slide over the coming months or not.
A strong showing through winter will be enough to guarantee a solid surplus of STCs left over at year’s end. A substantial reduction in supply during this time will mean the surplus will be smaller.

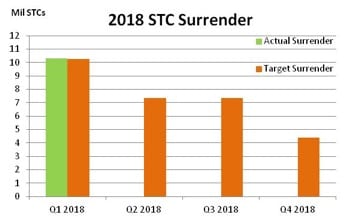
The passage of Q1 compliance saw a total of 10.28m STCs surrendered against the nominal Q1 target of 10.25m, or 35% of the annual target.
This is interesting because it is the first year since 2015 that Q1 compliance has not resulted in a surrender figure below the nominal target. It is not immediately clear why this is the case.
Marco Stellais Senior Broker, Environmental Markets at TFS Green Australia. The TFS Green Australia team provides project and transactional environmental market brokerage and data services across all domestic and international renewable energy, energy efficiency and carbon markets