
With the Clean Energy Regulator announcing ‘mission accomplished’ on the LRET during May, it was a mixed outcome for the LGC forward curve as ongoing scepticism surrounding the timing of project commissioning dates and the supply/demand balance over the coming 2-3 years.
Meanwhile the month also saw the first transaction in another of the electricity market’s new financial products, the inverse solar shape.
In 2018 the Clean Energy Regulator (CER) has taken a very proactive approach when it comes to the dissemination of its views on the project development pipeline, LGC supply and LGC prices.
It has undertaken a sophisticated modelling effort in an attempt to assess whether an LGC surplus will remain over the coming 2 years and at what point there will be sufficient projects committed to meet the overall target which peaks and flat lines from 2020.
In this regard the CER’s modelling has been bullish on project development timelines, with its statements in 2018 consistently reaffirming that the LGC market will remain in surplus throughout the 2018 and 2019 compliance years and that by 2020 it believes there will be sufficient projects commissioned to meet the overall target.
The CER’s most recent update in May was noteworthy as it hailed the achievement of a key benchmark, in that the tally of new projects under construction or already built had reached 6553 megawatts, a figure clearly above the 6400 megawatts that the CER is using as its target capacity for the 2020 target to be met.
There are also a significant number of additional projects representing very large capacity waiting in the wings for a power purchase agreement which would allow them to be financed.
While such a conclusion would seem to promote a cut and dried view of the market’s short to medium term demand/supply balance, amongst participants there remain those with differing views on the subject.
Some believe that the CER’s outlook rings true and that its timelines are accurate.
However, there are still many who believe that the assumptions around build times for many of these projects are overly optimistic and that the reality of such project developments is one of delays, both to construction times and, importantly, connection times.
Reflecting this uncertainty, the market itself is giving off mixed signals. For its part during May, a particularly subdued spot market softened gradually from the high $84s to the high $83s until the final days of the month when a sharp drop into the mid $82s took place.
The Cal 18s followed suit moving from the low $86s to the mid $84s by month’s end.
By far the most liquid of all the vintages however were the Cal 19s which rallied across the month from the high $77s to a peak of $79.20, before softening back to the mid $78s by month’s end.

While this set a clearly bullish tone for the mid section of the curve, the Cal 20 market traded down to $31 on a handful of transactions.
In a rarity of sorts the Cal 21 enjoyed its first reported trade since January, and at $27.00 it came in over $20 below that previous trade level.
Hence the widening backwardation evident in the LGC forward curve between calendar years 19, 20 and 21 implies a growing recognition that while there may be scepticism surrounding the CER’s shorter term predictions, the market is increasingly coming round to its longer term views.
Trade volumes in the latter vintages however remain low, which is an important point. And there are certainly still those who believe there may yet be a kicker in the Cal 19 and 20 compliance years.
When it comes to the latter though, the question for those holding unhedged LGCs is how much conviction do they posses in this view and how long are they willing to hold out?
Another influential development which gained prominence during the month and something which came as a timely reminder of the significant power of the Australian Energy Market Operator, was the judgement on updated marginal loss factor (MLF) calculations, which seek to identify the difference between the output which passes through a project’s meter and the amount of electricity that is actually delivered to customers.
Simplistically, a project that is a long way from energy consumers will have transmission losses associated with it and hence will receive less than 100% of its output in revenue (for example being adjudged to experience 8% losses and hence accorded a multiple of 0.92).
It is also possible in areas where a project is close to customer load that would otherwise require significant transmission from other distant generation to receive a positive factor, say 1.09, recognising the benefits to the grid that its deployment in the area represents.
The key here is that each year the MLF calculations change and in doing so can result in a material impact on a project’s economics.
As part of this year’s changes, the more egregious reductions saw some projects’ factors cut by well over 10% (over 20% in one case), an outcome easily enough to freak out finance departments across the country.
It’s important to note these changes impact projects that are already generating as well as any new projects coming on line in the area.
Beyond that there is the potential impact on as yet uncommitted projects with this issue a timely reminder of risks that may have been being overlooked or at least down played by some.
Finally, May saw the first transaction in a second of the new financial products being deployed in the electricity market, the Inverse solar shape, also known as a solar firming product.
The instrument represents the inverse of an averaged solar production profile and hence purchasing it would allow those who own or who have contracted generation from solar projects to firm that project to a flat swap.
The first trade in this product was in 10 MW against the New South Wales node and was agreed at $66.25.

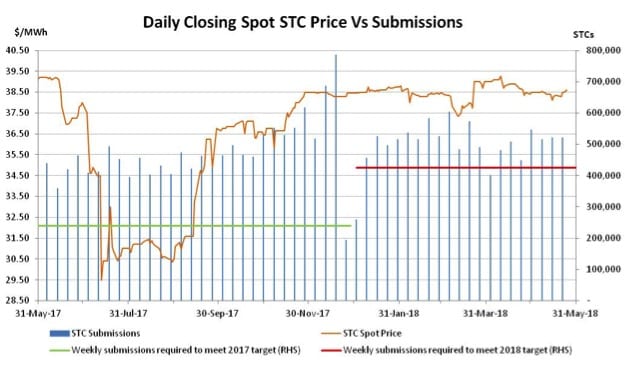
The passage of Q1 compliance saw a gradual softening in STC prices, while the relief from public holidays which hampered installation activity across April also brought a recovery in submissions numbers.
May too saw the release of a Clean Energy Regulator update outlining its expectations for the STC surplus across the year.
Having surprised many on lookers across April in surpassing the $39 mark quite early on, the heat had already come out of the STC market by the time the final compliance date passed.
In May the spot market softened gradually across the month to reach a low of $38.10 in the second half of the month.
Following a quieter period the spot then recovered to trade back into the mid $38s by month’s end.
While not as busy as in previous months, there was none-the-less active trade in forwards for settlements in the latter part of 2018 and first half of 2019 taking place in the high $38s along with a number of 2020 trades at $38.20.

The absence of public holidays which so consistently impacted on April’s installation capacity saw STC submissions climb across May, with a four week average of 525k the result; a healthy buffer above the 425k required by the target.
On that note, the Clean Energy Regulator released a market update during May stating that STC creations have been well above the rate required by the target and that if current rates of creation continue, that surplus would grow.
In what became a source of some confusion and debate, the CER stated that at current creation rates, by the end of the year a ‘surplus’ of 9.5m STCs would exist.
This prompted some to assume it was expecting a major increase in STC submissions to the well above 600k per week that would be required to produce such a result.
It appears instead that the definition of ‘surplus’ in this case meant ‘STCs available for surrender’, but did not include the Q4 surrender requirement.
Assuming the latter then it appears that the number of STCs eligible for surrender against 2018 obligations left un-surrendered after the compliance year will be in excess of 5m, roughly the same quantity of STCs that were left over after April’s surrender.
With the winter months looming the big question for STC supply is whether or not the typical seasonal decline that is generally experienced across winter, but was so strikingly absent last year, will take place this year.
Marco Stella is Senior Broker, Environmental Markets at TFS Green Australia. The TFS Green Australia team provides project and transactional environmental market brokerage and data services across all domestic and international renewable energy, energy efficiency and carbon markets.