NEM power consumption reduces 0.4%
Solar and energy efficiency installed in 2018 account for 1.3% of demand
Greenhouse emissions fell by 3.9% in 2018
Renewables increase market share from 17.3% to 21.8%
30 AEMO Metered renewable plants start operating in 2018
1. Summary
Electricity consumption in the National Electricity Market (NEM) reduced by 0.4% in 2018, this is on top of a 0.6% decrease in 2017. All states except Tasmania experienced reductions in electricity consumption.
We estimate that solar energy and energy efficiency activities supported by the Renewable Energy Target and various state-based energy efficiency schemes reduced electricity consumption by 2,480 GWh. This is the equivalent of a 1.3% reduction in total consumption.
Renewable generation (including roof-top solar) accounted for 21.8% of total generation which was considerably higher than the 17.3% market share achieved in 2017. Hydro output increased by 28.6%, wind increased by 26.0% and roof-top solar increased by 20%. Large-scale solar is now starting to make headway and in 2018 generated 1.1% of all generation. As new large-scale solar projects come on line its contribution will be more material.
Gas-fired generation dropped significantly in 2018, falling by 26.6% on 2017 levels. Brown coal generation reduced by 6.0% largely due to the full years impact of the closure of the Hazelwood power station in March 2017. Black coal generation increased marginally during 2018 predominantly from Queensland generators.
With lower generation from brown coal and gas being predominantly replaced by an increase in renewable generation, emissions intensity of generation reduced by 4.5% falling from 0.758 tonnes per MWh in 2017 to 0.724 tonnes per MWh in 2018.
This Green Markets Insight analyses the changes in electricity generation and consumption in the NEM for the year ending 31 December 2018 and compares it to the same period in 2017. Our analysis is based on scheduled metered demand and metered generation data published by the Australian Energy Market Operator (AEMO) and provided through NEM-Review.
The data does not directly measure actual consumption as it includes transmission losses, power station auxiliary use (power used in the power station) and excludes non-metered generation. We have incorporated estimates for non-metered renewable generation based on expected renewable energy certificate creation (adjusted for baselines).
As transmission losses, auxiliary use and non-scheduled generation have been fairly stable in recent years it nevertheless provides a solid basis for analysing year on year changes to electricity consumption.
2. NEM electricity consumption
After declining for a number of years electricity consumption in the NEM (as measured by scheduled demand) has been relatively flat over the last 5 years and decreased slightly (by 0.4%) in 2018 (refer to Figure 1).

Electricity consumption decreased slightly in all states other than Tasmania which increased by 1.6% (Table 1).

Approximately 1,369 MW of roof-top solar PV was installed in NEM states and created certificates under the Renewable Energy Target in 2018 (refer to GEM Market Insighthere). Total generation in 2018 from roof-top solar PV was 8,148 GWh which was 1,355 GWh more than 2017 levels and appears as a reduction in scheduled demand.
The contribution of solar hot water and an array of energy efficiency activities supported by state based energy savings schemes have also contributed to lower electricity consumption. There are four energy efficiency schemes operating across the NEM; in NSW, Victoria, South Australia and the ACT.
We have analysed the number of certificates or abatement that has been generated by a range of approved activities over the 2017 and 2018 period to estimate the full year impact. In total, identifiable energy efficiency activities could reasonably account for 1,043 GWh of demand reduction in 2018 (Figure 2).
We estimate that solar installations supported by the Renewable Energy Target and energy efficiency activities supported by the various state-based schemes will have contributed 2,480 GWh in 2018, equivalent to a 1.3% reduction in total consumption for the year.
The impact of a variety of other factors such as population growth, economic growth, changes in manufacturing usage and weather contributed an increase of 1,811 GWh (1.0% of total consumption).

3. Power generation in the NEM
In analysing metered generation we have included all generators for which AEMO publishes generation data. This includes all scheduled generation and also larger non- scheduled generators which are predominantly hydro, solar and wind generators. We have also separately estimated and included non-metered renewable generation (3,937 GWh in 2018). The total generation figures are thus slightly higher than the scheduled demand.
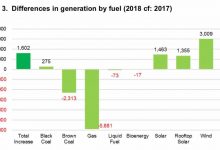
Changes in the generation mix in the NEM for 2018 are summarised in Figure 3. Hydro increased generation in 2018 by 28.6% after having fallen in 2017 by 24%. Hydro in all states increased its output, largely in response to higher wholesale prices and high Renewable Energy Certificate prices.
Black coal-fired generation in Queensland was responsible for the increase in black coal fired generation of 0.3%. Gas-fired generation dropped significantly across all states as higher gas prices made it more difficult for gas to compete. Gas-fired generation’s market share was 7.9% in 2018 markedly down from 10.7% in 2017.

Wind generation increased by 26.0% in 2018. This was due to the commencement of 9 new wind farms (refer to Table 3) and a full year’s output from the White Rocks, Hornsdale and Kiata wind farms. In addition 2018 was windier than 2017. Wind accounted for 42% of South Australia’s total generation in 2018, markedly higher than the 37% achieved in 2017.

4. New generation projects
Thirty large metered renewable generators came on line in 2018, including twenty one large solar power stations (Table 3).

5. Generators that were closed or mothballed
No generators were closed or mothballed during 2018
6. Greenhouse gas emissions
Greenhouse gas emissions decreased by 3.9% in 2018 (Table 4). The emission intensity of generation reduced by 4.5% falling from 0.757 tonnes per MWh in 2017 to 0.723 tonnes per MWh in 2018. The reduced emission intensity was due to renewables replacing brown coal and gas-fired generation.

Notes and references:
- Electricity consumption data has been sourced from AEMO (NEM-Review) and reflects the level of scheduled generation required to meet that demand;
- The AEMO metered generation data includes scheduled generators and some of the larger non-scheduled generators. Generation from smaller non-scheduled renewables are separately estimated based on the expected level of Renewable Energy Certificate creation adjusted for baselines;
- Roof-top solar PV is included as a reduction in demand in Section 2 and we have chosen to include it as a generation source in Section 3;
- and Emissions intensity data by NEM generator has been sourced from the ACIL Allen Report to AEMO dated 10 May 2016 “Emission Factors – Assumptions Update”.