Data for electricity supply and consumption in the National Electricity Market (NEM) up to the end of March 2014 show that annualised consumption and emissions both fell (Figure 7). The fall in annual consumption, compared with the year to March 2012 was 4.5TWh, equivalent to 2.4 per cent. The fall in emissions, compared with one year ago, was 6.2 Mt CO2‐e, equivalent to 3.7 per cent.

It is now over five years since both annual electricity demand and total annual emissions from generation in the NEM reached their historical maxima. The total fall in demand over those five years has been 15 TWh, equivalent to nearly 8%, while the total fall in emissions has been 31.5 Mt CO2‐e, equivalent to over 16%.
Interestingly, in the year to March 2014, output from black coal, brown coal, hydro and wind generators all fell slightly, compared with the year to February, and the overall emissions intensity of electricity supplied rose slightly. Thus lower total output, i.e. lower demand for electricity was the reason that total emissions continued to fall.

Gas was the only major source of generation which increased its output in the year to March 2014 (Figure 8), and this was almost entirely attributable to significantly increased generation from three of the new power stations in Queensland: Braemar, Braemar 2 and Darling Downs.
All three are located on the Darling Downs, close to major coal seam gas fields. Braemar and Braemar 2, although new, and thus intrinsically more efficient than older, equivalent generators, are both open cycle gas turbine plant, which would be expected to be used for peaking only, at low capacity factors.
Braemar, in particular, was operated throughout March at a very high average capacity factor of 55%, up from 46% in February. The intrinsically more efficient, and hence lower operating cost, Darling Downs combined cycle power station also increased output in March.
By contrast, Tarong, the oldest of the coal fired power stations in south east Queensland, having effectively shut down two of its four 350 MW units at the end of 2012, further reduced output at the beginning of March 2014. While it continues to operate two units, both are generating at no more than half their rated capacity.
A probable explanation for the increased gas generation is that the plants have access to so‐called ramp, or ramp‐up gas. This is the term used for gas which is ultimately destined for the LNG plants being built at Gladstone.
Supply of coal seam gas, in contrast to “conventional” natural gas, requires a very large number of individual wells. Since it is obviously not feasible to complete all the required wells on a just in time basis, supplies of gas from completed wells ramp up during the construction period of the LNG plants, leading to a short term excess supply, and hence lower short term costs. Both will vanish when the LNG plants are commissioned.
With the end of the summer of 2013‐14, it is possible to look at the seasonal peaks in each state. Despite several episodes of extreme heat wave conditions, summer peak loads in every state were below the historical maximum. This maximum was reached five summers ago in Victoria, four in Queensland, three in NSW and SA and, even in WA, which has not seen the same fall in overall demand, two summers ago.

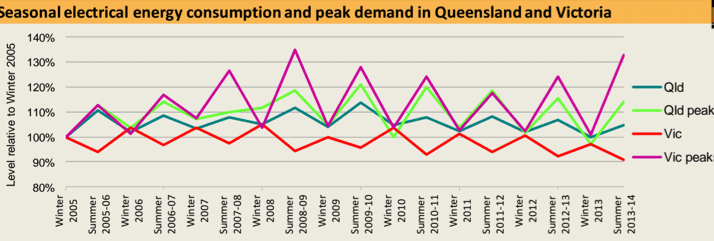
The experience in Queensland is particularly notable because, with NSW, it was one of the two states where, six or so years ago, expectations of continuously escalating summer peaks led to the regulatory approval of massive network capacity upgrade expenditure, and subsequent large retail electricity price increases. Figure 9 shows both the seasonal peaks and total seasonal electricity consumption (summer is December to March, winter May to August) in Queensland and Victoria.
It can be seen that in Queensland both total energy and peak demand have fallen continuously for four years, despite the growing state population over that period. Our hypothesis is that, since household air conditioning has been the norm in Queensland for much longer than in other states, the replacement of a large stock of older, inefficient household air conditioners with much more efficient newer models has made an important contribution to both reduced demand and lower peaks.
In Victoria, two features stand out. First, considerably more electrical energy is used over winter than over summer; this effect could increase as households shift from gas to reverse cycle air conditioning for their space heating. Peak demand, however, is always in summer.
Secondly, there is much more year to year variation in the summer peak than there is in Queensland. This is because of the occasional occurrence of extreme summer heatwaves, a phenomenon not common in Queensland, where maximum temperatures are much more consistent throughout the summer months.
This pitt&sherry’s Carbon Emissions Index (cedex) update on emissions from generators in the National Electricity Market (NEM) up to the end of March 2013 was republished here with permission