Key points
– The year to June 2016 saw a continuation of the slowdown in demand growth first seen last month.
– Total emissions from electricity generation in the NEM fell slightly in the year to June 2016. Annual emissions were 5.7% higher than in the year to June 2014.
– Total coal generation fell slightly to 75.8%, compared with a minimum of 72.3% in the year to July 2014. Gas generation fell again, for the eighteenth month in succession. Both hydro and wind generation increased and, as a result, total renewable generation reached 13.6%, its highest level since September 2014.

Demand
Total annual demand for electricity fell slightly in NSW, SA and Tasmania and increased very slightly in Victoria. Demand continued to increase in Queensland, but more slowly than in previous months, suggesting that demand outside the coal seam gasfields may have fallen, as in the other states (Figure 1).
Demand in WA also increased, though only slightly, in the year to May 2016. Total annual NEM demand in the year to the end of June was 2.7% higher than the minimum value, which was in the year to February 2014. It is of course too early to say whether, after a year or so of increasing demand, we are seeing another trend reversal.
Generation and emissions
As demand was almost completely flat from May to June, so too was generation. Emissions, however, fell, in line with the fall in coal generation (Figure 2). Black coal generators supplied 53.2% of total supply and brown coal generators supplied 22.6%, making a total coal share of 75.8%, down from nearly 76.2% in the year to April 2016, which was the highest coal share since September 2012 (Figure 3 and Figure 4).
The closure, in early May, of Northern power station in SA made a small contribution to the lower total coal generation, offset by continued increase in Queensland to supply the demand from the coal seam gasfields. However, the main cause of lower coal generation was increased supply from renewables.


Good rainfall across the catchments in May and June saw hydro generation in June rise to its highest monthly level since June 2014, and annual hydro to its highest level since November 2014. In Tasmania, Hydro Tasmania was able to shut down most of its gas generation and meet all demand in the state without needing to make more than nominal use of its two biggest power stations, Poatina and Gordon.
This allowed energy in storage to reach 29.1% of full supply level by the end of June, up from its minimum level of 12.8% in late April. The two deep storages, Gordon/Pedder and the Great Lake, remain at low levels (17% and 23% respectively) but are currently rising. There was also no need to import electricity from Victoria, notwithstanding the re-opening of Basslink, following completion of repairs, on 13 June.
In Victoria, hydro generation, most of which comes from the two Murray power stations in the Snowy scheme, reached its highest monthly level since July 2012 and its highest annual level since February 2014. In NSW monthly hydro generation was less dramatic, because output from the Tumut power stations in the Snowy scheme ran at higher levels earlier this year. However, this meant that annual generation reached its highest level since December 2013.

Wind generation in the month of June was less than in May, but total annual wind generation in the NEM reached a new record level of 10.54 TWh, equal to 5.84% of total supply. With small contributions from bagasse generation in Queensland and large solar generators in NSW, total renewable generation in the months of May and June reached its highest ever level as a share of total NEM supply, at 16.7% and 16.6% respectively. On an annual basis, total renewable generation in the year to June 2016 was 13.62% of total supply, the highest level since September 2014.
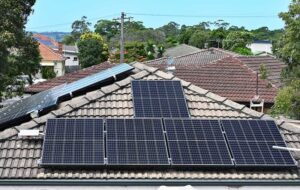
As households and, increasingly, businesses continue to install rooftop solar generation, distributed solar generation continued its steady growth. In the year to June 2016 its output added an estimated 2.8% to the electricity supplied at the wholesale level in the NEM (and 3.0% of NEM supplied electricity used by consumers when allowance is made for transmission and distribution losses in moving the electrical energy from power station to consumer).
Some of the rooftop solar electricity generation is exported into local distribution networks and some is consumed “behind the meter”, and therefore only seen by the electricity supply industry as a reduction in consumer demand.
Finally, gas generation also fell again, to 19.5 TWh, which is the lowest annual level since March 2010, and equal to 10.51% of NEM generation. As has been the case for many months, this was driven by reduced generation in Queensland. Gas generation increased in SA, following the closure in May of Northern power station. Most of the increase came from the ageing Torrens Island A and Torrens Island B stations, owned by AGL, which in early June announced that it had withdrawn its previously announced decision to mothball Torrens Island A in 2017.
Torrens Island A was commissioned in 1967, making it the oldest thermal power station still operating in the NEM. Increased gas generation in SA also came from the Osborne, Quarantine and Ladbroke Grove stations, all of which are operated by Origin Energy. As the two largest electricity retailers (commonly termed gentailers), not only in SA but across the NEM, AGL and Origin have the decisive advantage of being able to self-hedge the high cost of gas generation.
That is not available to Engie, which owns Pelican Point, the newest and most efficient gas fired power station in SA. Two years ago Engie mothballed half of Pelican Point and since then has operated the remaining capacity only intermittently. Engie is best known in Australia as the owner of Hazelwood power station Victoria, but it does not have a retail presence.
Hugh Saddler is an energy analyst with Pitt & Sherry and The Australia Institute.


