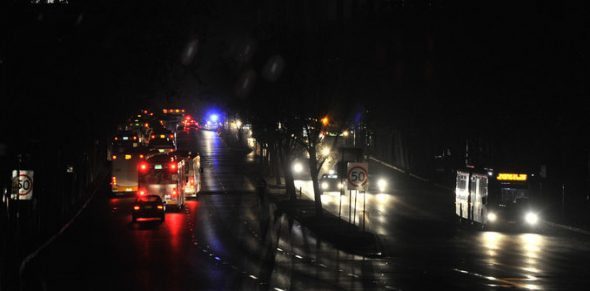
This week, the Australian Energy Market Operator published a helpful preliminary report on the power outages in South Australia on 28 September 2016.
The report is long on data and, perhaps quite appropriately at this stage, commensurately short on narrative. What might reasonably be made of the data, at this stage, in understanding what happened?
In summary, at 16h18:16.2 Australian Eastern Standard Time, the lights went out, approximately 1.2 seconds after the third 275kV transmission line was taken out of service after single-phase and double-phase to ground faults progressively disabled three of the four 275 kV transmission lines from Davenport, over the previous 43 seconds. One of these three lines had successive single-phase to ground faults within 9 seconds, and was disabled after the second.
The system frequency was stable until the last of the three lines was disabled, but the Heywood interconnector disconnected 0.8 seconds after the third line was disabled and the system frequency in South Australia collapsed to zero, 0.3 seconds after that.
Immediately after the first 275 kV transmission line (from Davenport to Belalie) was disabled, approximately 133 MW of wind production from North Brown Hill, Bluff, Hallet Hill and Hallet wind farms was lost.
The North Brown Hill and Bluff wind farms are connected to the busbar at which the Davenport to Belalie line terminates. The Hallet Hill wind farm is connected to the Mokota substation a little further downstream.
Immediately after the third 275kV line (Davenport to Mt Lock) was disabled, another 192 MW of wind production was lost from Hornsdale and Snowtown 2. Hornsdale is connected to the Mt Lock substation.
To make up for the lost wind farm production, the Heywood interconnector flows had now climbed to more than 800 MW (after having been at 500 MW before the first line was disabled) and it then disconnected.
The storms wreaked amazing havoc with the power lines. Before the black-out only one of the four parallel 275 kV circuits (from Davenport to Para via Munro Para and Bungama substations) was left undamaged. After the black-out, another bunch of 275 kV towers from Davenport to Binkworth were damaged.
With what we now know, was the blackout a transmission failure or a generation failure? The sequence of events was weather-inflicted damage on transmission lines which then had a knock-on effect on generation which then had a knock-on effect on interconnectors and from there, separation from Victoria and black-out in South Australia.
Should the wind farms have withstood these network faults and kept going? AEMO notes that some of the winds farms connected to the 275 kV lines did not “ride-through” the network faults of which AEMO identify four 275 kV major network faults in the 43 seconds before the system blacked out.
But could the wind farms have been expected to ride through the events that occurred? Says who? And if so, are such expectations well informed?
It might be suggested that the black-out was influenced by interconnectors flowing west too close to their limits before the severe weather disabled large parts of the main transmission system.
Running close to flat out they could not then provide the necessary insurance for the extreme events in South Australia. Might it have been anticipated that the weather could have had an effect on the transmission system and so sufficient headroom left on the interconnectors to ramp-up in the event of the sort of contingencies that occurred?
Might it also have been better to constrain-on Torrens Island or other southerly gas plant in anticipation, Torrens being at the southern end of the 275 kV network and hence much closer to the main loads in Adelaide thus mitigating dependency on relatively remote power susceptible to the extreme weather?
And, over and above these, was the remaining 275 kV line able to move circa 650 MW of electricity securely from the North and mid North after three of the four 275kV lines originating in Davenport had been disabled?
The febrile environment in which this is being examined can undermine measured discussion. It is important to get to the bottom of this and figure out what needs to change in the configuration and operation of the power system.
As so often the case, as we dig into this we will probably find mistakes that are many and varied. Those portraying this black out as some kind of systemic failure of wind generation have been pushing water up hill and the hill seems to be getting steeper as we go along.


