At RenewEconomy, we’ve written a lot about South Australia’s world leading switch to wind and solar, which now accounts for around 64 per cent of annual local production and could reach its extraordinary target of “net 100 per cent” renewables within a few years.
That makes it a remarkable transition for a grid that just 20 years ago was entirely dependent on fossil fuels, made up of two of the country’s dirtiest coal generators and a heap of gas-fired power stations.
Two new reports underline just how dramatic this transition has been, how South Australia has leaped ahead of its neighbouring states, and how it has reaped the benefits of both lower wholesale prices and a deep cut in grid emissions.
First, to set the overall scene, this first graph comes from analyst group Ndevr and highlights the uptake of renewables in the four mainland states that – along with Tasmania – make up the National Electricity Market since 2005.

South Australia didn’t overtake the other states until 2008, but since then it has grown dramatically, thanks not just to its strong wind and solar resources, but also a favourable investment environment.
It’s a stunning outperformance, and illustrates that a rapid switch to renewables can be done, and has been done.
The strategy was devastatingly simple: The state government made it clear it would welcome wind and solar investment, and the projects followed. If only Australia had a federal government that could say the same.
The next graphs come from the recent the regular report from Australian National University’s Australian Energy Emissions Monitor, produced by Dr Hugh Saddler.

The first graph (above) shows the change in generation in South Australia over the last seven years. Coal ended in 2016, wind and solar have grown consistently since then, and the share of gas has gradually diminished.
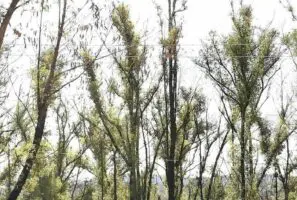
The next graph goes back further, and shows the source of generation from the year 2000. South Australia’s first wind farm – the small 33MW Starfish Hill facility (pictured above) – was only built in 2003, and wind energy barely made a dent in the generation mix until 2006.
Rooftop solar began to make an appearance a decade ago, and has grown steadily to the point where it accounts for nearly all domestic demand on some occasions, and large scale solar first entered the market in 2018.
What this next graph also shows is the course of emissions and prices. Both have fallen dramatically since 2008, putting a nonsense to claims that the transition to renewables neither brings down prices, nor emissions.

The Australian Energy Market Operator recently identified the “north-south” divide in wholesale prices, noting that the states with the highest renewable share – South Australia and Victoria – had significantly lower average prices than the coal dependent north, NSW and Queensland.
Those observations have been borne out in recent pricing movements, and are likely to again be a focus of the latest quarterly market insights to be released by AEMO on Friday.
The following graphs show how the renewables story has unfolded in other states.
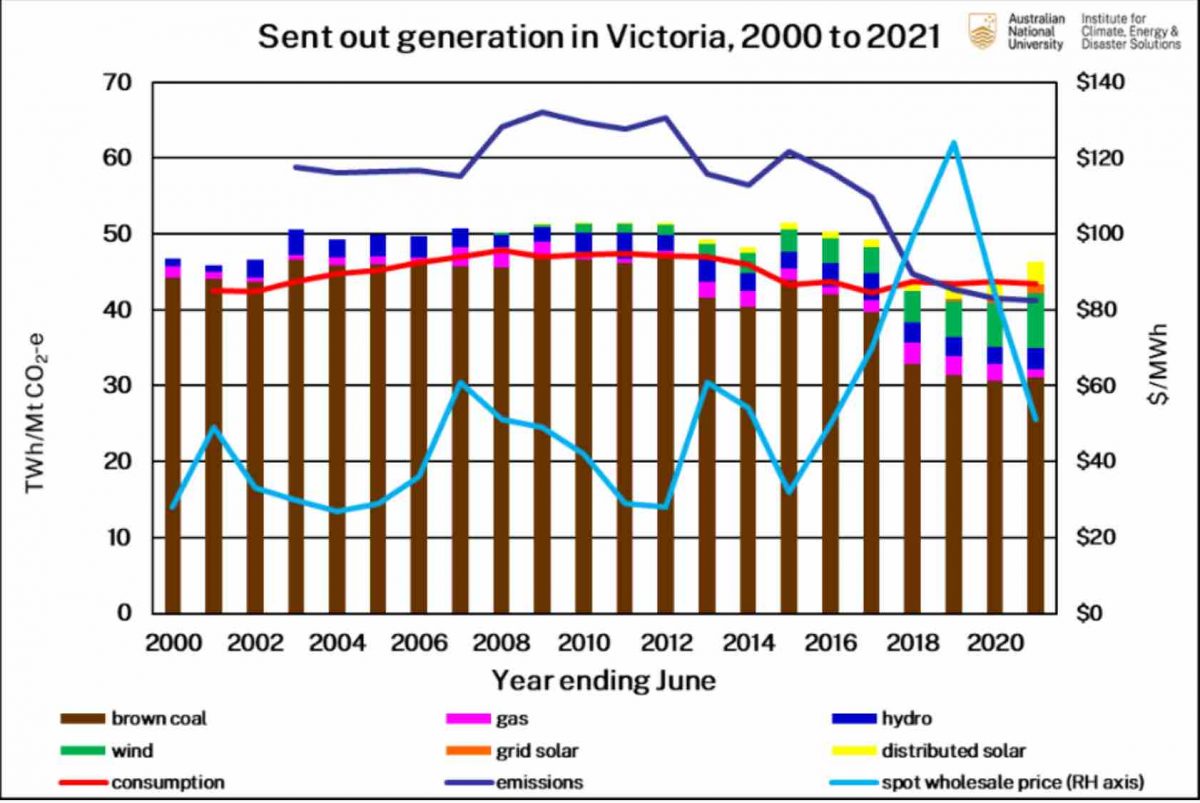
The first is in Victoria. Prices jumped in 2018 after the unexpected closure, at very short notice, of the Hazelwood brown coal generator, which also caused a step change in the emissions profile.
The state, it is clear, has a lot to do to reach its interim target of 40 per cent renewables by 2025, and 50 per cent by 2040. One of the remaining big brown coal generators, Yallourn, is due to close in 2028.

The next graph shows NSW, which has barely moved emissions over the last eight years, apart from some small improvements as a number of new renewable projects were connected in the last two years, and which also helped relieve its comparatively high wholesale price.
Those price gains, however, have since been reversed by the big jump in coal and gas prices, which – more often than not – set the price for the wholesale market.
NSW is a state to watch, however, because the NSW is laying out a renewable infrastructure plan to replace the coal generators that will retire in the next decade. Liddell will be first to go in 2023 and the biggest, Eraring, will follow in 2025.

In Queensland, the situation is depressing, Emissions remain higher than they were more than a decade ago, despite a recent slight fall as more solar entered the market, and prices remain high, and are the highest now in the country.
The state government also has a 50 per cent renewables target for 2030, but is also steadfast in its refusal to countenance the early retirement of any of its coal generators. It is even rebuilding the Callide coal unit that exploded last year.