Volumes are soft in Australia, but it’s a seasonally weak time of the year anyway. The following numbers are the “in front of the meter” or “operational demand” that ignores rooftop solar PV.

Regarding pool prices, they are well down both for the calendar year to date and despite the bush fires.

And more obviously in the last 7 days compared to the same week last year.

The spot data are not reflected in futures prices, which I don’t show this week because futures traders see that in a year’s time things will be back to normal. Of course a year is a long time from many people’s perspectives right now.
I suspect the decline in volumes is mostly commercial, household volumes likely picking up and industrial volumes modestly down, eg oil refineries cutting back.
For a point of comparison electricity volumes in China for the combined January- February period (January is not separately reported) were down 10%
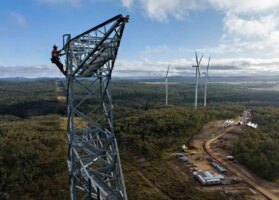
Wind and solar combined [VRE] hold about 18% of the total market and that share is still certain to grow strongly as more and bigger projects currently under construction enter the market. Stockyard Hill, for instance, is nearing energization.


