Networks are in the news and we take a quick look at outcomes over the past decade and the forward look. There was little significant visible change in most other numbers and we would say the electricity and gas sector is in cruise mode just now.
Networks – Prices likely to stay where they are
The Energy Insiders podcast a fortnight ago was an interesting discussion with Richard Gross, the new CEO at Ausgrid.
It was only in 2017 that Ausgrid with other NSW networks were successful with very significant appeals to Full Bench of the Federal Court against decisions made as far back as 2014 by the Australian Energy Regulator [AER].
The AER attempted to cut Ausgrid’s revenue substantially by allowing less opex and a lower amount of revenue to compensation for interest expenses than Ausgrid felt was fair.
Ausgrid’s win though was something of a pyrrhic victory in that the Federal Government essentially countered by passing legislation that removed most grounds of appeal to the Australian Competition Tribunal [ACT].
AER decisions can still be appealed to the Federal Court but this is much more expensive and within the industry its expected to be less likely.
In addition interest rates have risen. When Australian Super and IFM bought 50.4% of Ausgrid in 2016 it represented an enterprise value (100% of equity and 100% of debt) at $20 billion, although Aussie Super and IFM effectively only wrote a combined cheque of about $4 bn.
$20 billion represented about 1.4X regulated asset value and about 15X ebitda. Ausgrid has around $12 billion of debt, although the company has yet to publish its 2017 annual report.
NSW Treasury does publish the results of its special purpose company that owns 49.6% of Ausgrid but this report tells us very little about the underlying business.
The Grattan Institute has today called for a writedown in network regulated asset base [RAB] to reduce tariffs as it says the networks have been overbuilt or “gold plated”. Whether this is or is not correct it’s a laughable idea in the short term at least in NSW.
You can’t have the Government selling the asset one year and a year later cutting its value. Even to give customers a rebate is an admission of overbuilding that would have consequences in subsequent regulatory hearings.
At least in NSW households will pay high distribution costs on the RAB and get the benefit in the form of better public transport. I personally remain happy with that bargain made on NSW consumers behalf by Mike Baird.
Tariffs a couple of points
One thing to know is that for households at least the network tariff is largely a function of the distance between each connection.
We can see this by comparing the tariffs of inner Melbourne network operator Citipower with those of suburban Powercor. Both businesses have the same owners. What this means is that there is no way to charge for household electricity that will have a material impact on prices.
Demand charges at the household level are correlated with consumption charges, but we think consumption is easier to understand.
If there are demand charges they should be at the time of the network peak not the household peak if they are to make much difference, but that is not what was proposed in Victoria or South Australia.
If electricity is charged for at flat rate, that is a fixed charge each year, then its regressive, falling most heavily on low income earners. None of these pricing methods really contemplate peer to peer trading or microgrid issues. For networks, there are no easy answers.

The regulator has published a numeric review of network performance
We are going to reproduce a couple of charts. This first one is the most important and shows network revenues from 2006-2016 as an index.

I think this chart may overstate the decline in NSW following the court outcomes but still revenues are flattish in real terms. But then so are volumes, and if volumes decline further under a revenue cap prices have to go up.
In response to falling revenues, at least in NSW headcounts have been cut fairly dramatically. Ausgrid’s head count has come down from 6000 to 4000. That’s fairly harsh if you are working in that business.

The following two charts are busy. From the first you can see that customer numbers are up 15% over 10 years but energy supply is down 2%. Circuit length or kms of wires and poles is growing only very slowly less than 1% per year.

In the next figure I focus on the green opex line (opex is 38% of network revenue allowances and also the growth in transformer investment (orange line).

Two other points to cover in today’s note are (i) Ausgrid’s revenue proposal
The following figure shows what Ausgrid, largest of the NSW distributors, is looking for in the 2019-2024 period.

You can see that the biggest part of the network bill is the allowance for a return on capital. The return on capital revenue is Capital base [RAB] x allowed return on investment.
Whereas the Grattan Institute complains about the RAB, as have many others in the past, we think there is a more likely, but smaller chance of some reduction via the return on investment allowance. Without getting too bogged down the return on investment is calculated as:
Return on debt (pretax) x debt weight +
Return on equity x equity weight
There was a huge fight over the return on debt calculation but that is over and was won by the networks. However the AER is currently reviewing the return on equity. The return on equity is measured as:
10 year bond rate +(return on market x beta)
The return on the market currently allowed is 6.5%. This is too high. Its obviously too high in a world where bond rates are 2-3%. We think the AER could cut it to 6% and the networks would be stuck with it.
The beta allowed is 0.7. For a discussion of beta, which measures correlation of stock with the market and is a measure of non avoidable and therefore rewarded risk see the theory of finance. I was surprised to see the median beta of the listed network stocks is around 0.82. I was expecting about 0.6

Based on market parameters maybe there isn’t much in it at the moment.

The weekly numbers
- Electricity demand is soft and for the CYTD is down 1%.
- Spot electricity prices are well down, very well down on last year.
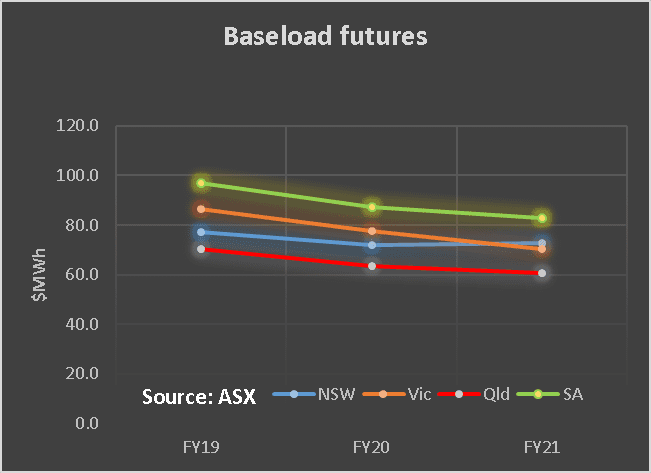
- Futures prices have drifted off 1% but not in a convincing manner.
- Spot gas prices are down on last year, reflecting, we think, lower demand rather than any supply change.
- REC prices are flat.

Oil prices have strengthened considerably up 10% on the week in US$ terms and 13% in A$ terms. This will flow through to the export price for LNG contracts and therefore, but less closely, into spot LNG prices and therefore into domestic gas prices. However the oil price is volatile so not too many medium term takeaways can be made.
The gap between Aussie and US bond continues to open up with USA 1o year bonds now a clear 18 bps higher than in Australia. As good as that is, it’s the USA bonds that need to be watched as they are the lynchpin for global credit and for the USD.

Share prices
Share prices drifted. Lithium shares remain on the nose. There are repeated stories that the “lithium bubble” is going to burst or has burst.
That may be the case and eventually will be true. However for the time being our optimism on demand growth is greater than our pessimism on supply growth.


Volumes

Baseload Futures, $MWH


Gas Prices


David Leitch is principal of ITK. He was formerly a Utility Analyst for leading investment banks over the past 30 years. The views expressed are his own. Please note our new section, Energy Markets, which will include analysis from Leitch on the energy markets and broader energy issues. And also note our live generation widget, and the APVI solar contribution.