IEA’s low carbon scenario again underestimates the role of renewables

Note: IEA projections are for 2012 or 2013-2020 and for each 5 years thereafter, and are shown at the mid-point of each interval.

The IEA has just produced its World Energy Outlook Special Report on Energy and Climate Change, which is intended to describe how the energy sector can transition to being part of a lower carbon world.  It includes a new Bridge Scenario which emphasises what can be done over the next decade or two.  There is much that is good in the report, including its mention of the potential to reduce methane emissions from the energy sector, a subject which I’ll return to in a future post.  However its renewables projections are less satisfactory.

I previously noted how the IEA has vastly underestimated renewables growth in the past (see here), and that their current projections show future rates of deployment of renewables slowing substantially from present levels (see here).  I had hoped that, especially given its topic, this latest report would include a more realistic outlook for renewables.  However even the Bridge Scenario projections continue to look much too pessimistic.

The table below shows a comparison of the IEA’s wind and solar PV projections for the 2020s with actual installations for last year and expected rates for this year.  It shows that the IEA projects installation rates for the 2020s at about last year’s level and below levels expected for this year, implying a stagnation or contraction of the industry rather than continued growth, even as measures to reduce emissions are increased.

Annual average installation rates for wind and solar PV (GW)

Notes: Historic data is taken from Bloomberg, BP, and the Global Wind Energy Council (GWEC). Data for wind installation in 2014 is similar at 49 GW, 52GW, and 51 GW respectively according to each source. Different data sources give somewhat different values for the amount of solar PV installation in 2015. BP shows solar PV at around 40GW, Bloomberg around 45GW. I have taken the mid-point of these two values. There are various possible explanations for the difference, for example different estimates of which projects were completed by the end of the year. Previous years’ estimates for the amount of solar PV installed are very similar between the two sources (within a GW or so).


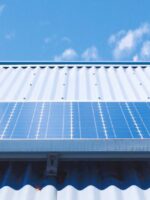
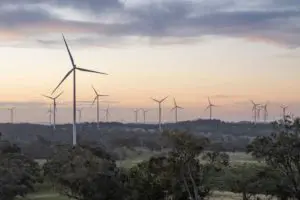
The IEA seems to continue to be concerned about the costs of renewables, leading them to be very cautious in their projections.  But with costs falling, pressure for action to reduce emissions increasing, and penetration of both wind and solar PV globally remaining well below saturation levels, continued growth in the rate of deployment seems much more likely than stagnation or decline.The chart below (an update from my previous post) shows this data graphically, and compares it with history and the IEA’s 2014 World Energy Outlook New Policies Scenario.  It shows welcome but limited increases in the rate of installation of both wind and solar PV projected by the IEA.  There is still a clear trend break between history and the projections.

Note: IEA projections are for 2012 or 2013-2020 and for each 5 years thereafter, and are shown at the mid-point of each interval.

The IEA’s work is widely respected and quoted.  This makes it all the more important that their renewables scenarios become more realistic.  Currently they serve mainly to distort the public debate on pathways to decarbonisation, and detract from the other good work in this area that the IEA does.   The time for the IEA to improve its projections for renewables seems long overdue.

Adam Whitmore is a leading expert on climate change policy and energy economics.  He authors a blog called On Climate Change Policy.

Comments

One response to “IEA’s low carbon scenario again underestimates the role of renewables”

  1. InsightWind Avatar
    InsightWind

    Very well said, Adam. And do keep up the pressure on the IEA. Somebody needs to hold this particular wolfe in sheep’s clothing to account.

    When editor of Windpower Monthly from 1985-2009, I was driven to a near frenzy of frustration by the IEA’s constant underestimation of wind power’s potential and the negative impact on public policy making that resulted. For those who are interested, the IEA’s pattern of misrepresenting the facts on wind goes back well over a decade, as I document below.

    May 2001
    From Windpower Monthly’s archive:

    “Global wind power capacity
    will more than treble to 58,000 MW within five years — and it will increase to
    145,000 MW by 2010. The projection for the decade represents an eightfold
    growth in capacity, says Danish company BTM Consult in its latest World Market
    Update, the fifth in an annual series on international wind energy development.”

    “At the
    estimated growth rate for this decade, the target for 2010 of 60,000 MW for
    Europe, set by the European Wind Energy Association (EWEA) in 2000, will be
    achieved “before 2006-2007.” BTM forecasts that Europe will reach
    41,900 MW, up from 13,630 MW at the end of 2005.

    The contrast
    with projections for wind by the International Energy Agency (IEA) is
    startling. Compared with BTM’s global figure for wind of 145,000 MW in 2010,
    the IEA is forecasting 34,000 MW — considerably less than BTM’s total for
    Europe for five years earlier. The IEA largely represents the interests of the
    conventional power sector. BTM refers to the IEA figures as “very
    conservative” and says “they do not reflect current trends in the
    market.” BTM notes that at present growth rates for wind it is likely
    “the IEA projection for the year 2010 will be achieved in the year 2003.”
    Historically, BTM has never overestimated wind power capacity and has
    frequently shot under the mark, while the IEA has consistently been proved
    wrong by wind’s growth.”
    For the full story:
    http://www.windpowermonthly.com/article/963759/massive-growth-little-impact-global-supply

    May 2002
    From Windpower Monthly’s archive:

    “Global
    wind power capacity is set to increase seven fold in the next ten years
    reaching 180,000 MW, according to the latest World Market Update on
    international wind energy development from Denmark’s BTM Consult. The figure
    lies in stark contrast to far more “conservative” predictions from
    two major energy authorities, states the report. For 2020, nine years ahead of
    the BTM horizon, the International Energy Agency is predicting just 67,000 MW
    of installed wind and the World Energy Council 185,000 MW, points out BTM. Even
    though the BTM outlook is more optimistic than that of the IEA and WEC, the
    wind industry has consistently outperformed BTM’s growth projections of the
    past seven years.

    Full story:
    http://www.windpowermonthly.com/article/956531/changing-trends-growth

    April 2003
    In 2003, the IEA raises its global wind capacity prediction for
    2012 by well over 50%, to 112,000 MW. Only a year earlier its 2002 prediction
    for 2012 was 67,000 MW. The actual global wind capacity reached at the end of
    2012 was considerably greater: 282,500 MW.

    From Windpower Monthly, April 2003:
    BTM’s forecasts have been
    consistently exceeded by the wind industry, though they remain far more
    optimistic than those of the International Energy Agency (IEA). The agency
    expects 112,000 MW to be installed by 2020 — compared with BTM’s 177,000 MW
    for 2012 — and 195,000 MW by 2030.

    Full story:
    http://www.windpowermonthly.com/article/952665/slightly-cautious-growth-prediction

    Fast forward to around 2006-2008
    and the wind industry’s confidence had grown. The kid gloves were off and direct
    public attacks on the IEA’s pessimistic predictions for wind were on. I was
    among those who in public forum in 2007 grilled the IEA’s Fabien Roques on the
    veracity of the IEA’s figures on wind versus fossil fuels, leaving him without
    a leg to stand on. A year later it was the turn of the IEA’s top man, Nobuo
    Tanaka, to come under wind industry fire, with myself and Greenpeace adding our
    voices to those of wind association lobbyists.

    Windpower Monthly reported on the
    attacks on Tanaka and the IEA here:

    http://www.windpowermonthly.com/article/955065/limited-world-energy-outlook

Get up to 3 quotes from pre-vetted solar (and battery) installers.