Electricity price rises are less than the price rises in other goods and services, and do not even rate in the top 10, according to the Australian Bureau of Statistics (ABS) Consumer Price Index (CPI) data for the period 2020 to today.
Since 40% of houses have rooftop solar, they probably don’t care so much about prices as they otherwise might have, any more than I know what the petrol price is. Business cares, of course.
The DMO (default market offer) has grown at a 6% compound pace from FY20 through FY26, led by an 11% CAGR (Compound Annual Growth Rate) in wholesale (generation costs) and 5% CAGR in network costs. Network unit costs are rising for a variety of reasons but flattish volumes are one cause.
Generation costs are up largely because of higher gas costs – and because supply is tighter, relative to demand. The increase in power costs paid by gentailers flows through retail prices, only with a big lag (over a couple of years).
The good news is that even though gas prices remain high, spot electricity prices have fallen FY26 YTD and, really, so far are not that much above FY20. The reason is fewer price spikes, due to a better wind outcome than last year and more batteries. That combination has reduced the need for high-priced hydro in the evening peak.
We can’t rule out more price spikes going forward, but I can say more batteries will reduce the price impact of momentary shortages of demand and I can also say that more wind will make that supply tightness much less likely.
Which of these does Chris Kenny blame on renewable energy?
No doubt, according to the National Party and Chris Kenny, renewable energy is to blame for all of them, particularly the price of eggs. The chickens have all been scared by the solar farms and refused to lay.
Regional residents are worried about renewable energy and drinking more and that’s put alcohol prices up. No one will live in the regions because of renewable energy and that’s put Sydney house prices up.
Vets are busy treating injured birds and scared feral cats and have put prices up. It’s all the fault of renewable energy. Right Chris?

CPI growth by category 2020-2024. Source: ABS, ITK analysis
Various items in that CPI index were adjusted by me, either for Covid or for the federal electricity rebate. I am happy with the resulting plot but also happy for any eagle-eyed reader who can see something I’ve done wrong.
Residential electricity prices – slight return
I last looked at residential bills back in February 2024. Following recent discussion by the federal Opposition, and comment by ABC’s 7:30 report based on work by IEEFA – and push-back from the ever unreliable and fully biased Chris Kenny at “Sky News” as published in the Australian – it seemed apt to take another, perhaps more detailed look.
I’ve done a lot of work on electricity prices over the years. Prices come in many flavours, eg: the actual bills consumers pay, international v domestic prices, industrial prices, network prices, futures prices, fuel prices, and mostly spot prices in the NEM.
Not only that, prices can be real or nominal.
Comparing residential prices around the world means allowing for distribution density, consumption and various taxes and subsidies that typically distort the underlying economics. In many ways I prefer to focus on spot prices, but most consumers don’t even see those.
Prices are less important to customers with behind-the-meter solar (and battery)
About 40% (50% in SA) of customers have behind the meter solar and so they have less volume exposed to their retailer’s pricing. There are many benefits to the large rooftop share but also at least one price raising issue, and that’s less volume going through the distributor wires and poles network.
Less volume but a fixed revenue requirement can only be solved by having higher unit prices. These higher prices come either from fixed costs spread over less volume, or from higher costs per unit of volume.
DMO (Default market offer)
It’s not that easy to get a history of residential prices. Paul Simshauser maintains an index but I haven’t seen an update of that in a few years. In the alternative the AER requires retailers to have a Default Market Offer (DMO) and the prices in the DMO are prescribed by the AER for each distributor franchise.
Only 8% of residential customers and about 16% of small businesses are on the DMO. The reason is that the DMO is deliberately set at a level which allows retailers to offer discounts and this is the main marketing point retailers use, besides “free” Netflix. Now that the next DMO will have to include a “solar sharer” tariff, that 8% may become more relevant.
The following plot shows the evolution of the DMO since FY20 and also indexes of the mean NSW spot price and Sydney spot ex post gas price.
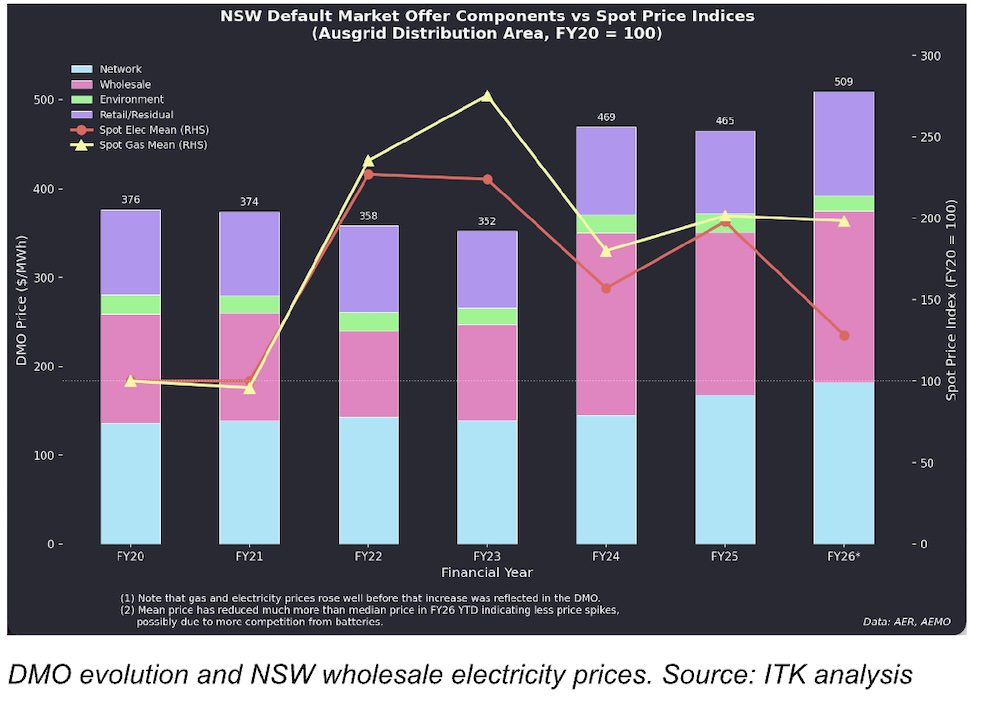
Because of the way gentailers buy electricity forward, the change in spot price from year to year is only gradually included in the DMO, and so even though the high electricity prices of FY23 have gone the impact is still being felt in the DMO.
However that’s old news. The exciting news, which may yet be an artefact, is that spot electricity prices in FY26 have fallen to $83.14 – well down on the $136.21 for the same period last year. That’s happened even though gas prices are essentially unchanged.
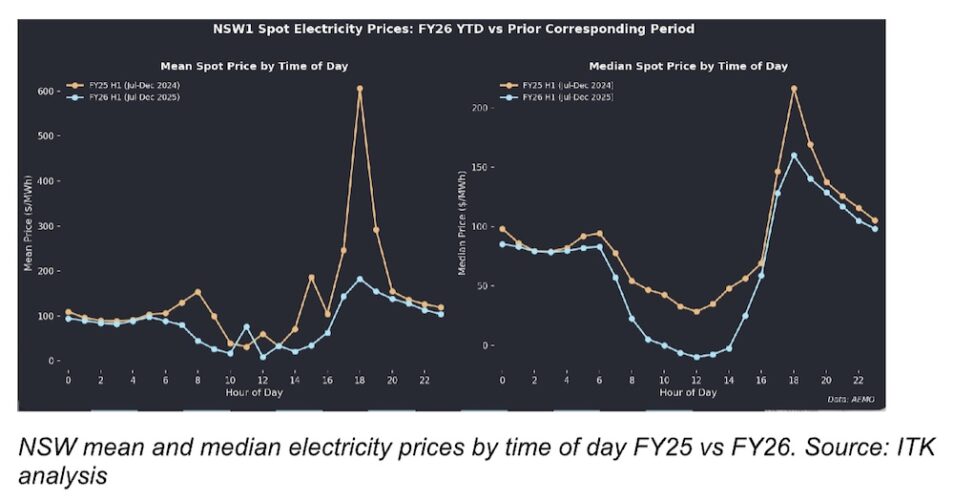
The reason for this is, I think, less price spikes. As I wrote in another note, it’s the 1% of the year when prices are above $1000 per megawatt-hour (MWh) that drives up average prices, compared to the median. The median is the price where half the prices are above and half below. The median is generally lower than the mean, because the lower limit of electricity prices, say negative $100, is much closer to the average than the market cap of $17,500.
The following plot shows how much mean prices have reduced in year-to-date compared to last year, but particularly in the all important 6 pm peak – a result that is due, it turns out, to more wind as well as more batteries, although also possibly better coal availability. It also shows in the median plot the extra solar mostly pushing down middle-of-the-day prices.
You don’t want to make too much of this data yet. There could be coal outages tomorrow that would push us backwards. Equally, though, there are still lots and lots batteries to come to market. And if New South Wales does it right, there will be lots more wind.
As usual, it doesn’t pay to jump to conclusions. In NSW, in this particular period looking at just the 5:30 – 7:30pm peak periods, hydro generation has been supplanted by wind and batteries. It’s long been my forecast that more batteries and more wind would reduce evening peak prices.
Wind is very much needed to do the overnight job. This year the extra wind is just due to a better resource rather than more capacity. Equally, I expected batteries and wind to replace gas not hydro but the plot makes sense.

NSW generation during evening peak 5:30-7:30pm FY25 vs FY26. Source: ITK analysis

The following plot clearly shows that the difference between this year and last year is price spikes.

In FY25 the price was above $1000/MWh less than 1% of the time, but during that 1% it lifted the average price for the 5 months by $41/MWh. This year we so far haven’t had those price spikes. For FY25, the 11% of time prices were negative reduced the average price by just $3 and the 19% of time prices were negative in FY26 YTD the impact is an even smaller $2.91. Focus on the spikes.
If I was telling the story (after the fact, of course) I would say that the extra wind reduced the pressure on supply and that when the pressure came the extra batteries offered more price competition. But that could be quite wrong and a big coal outage could indeed push prices up.