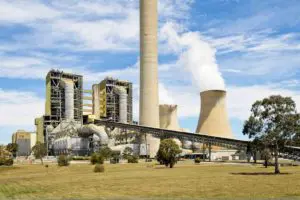
This is the bet the Australian Government wants to play. Federal Energy Minister Angus Taylor stated on the ABC, 7:30 Report that industry policy was in part about “making bets”.
We won’t get into whether it’s a good idea or not for industry policy to be based on bets, or whether the bets should be taken by the private sector, risking their own money, in pursuit of some government policy goal, like an emission target. Instead, let’s look at the main bet, gas.
And it’s to the private sector we turn, and what we observe is that in the US the sector is giving up.
I was going to write about electric vehicles and vehicle policy in Australia
And I still might, but in the meantime some stories just need to be broadcast. The process means revisiting background research on oil and gas, something I did a lot of in covering AGL and Origin Energy. It is, of course, a big topic involving everything from geopolitics to complex terminology.
Nowhere has this played out more than in the shale oil and gas sector in the US. First things first: Shale oil does exist and in the US oil production has increased dramatically and oil import dependence has reduced.
Figure 1 Source:EIA
But, equally it’s turned out to be an unmitigated financial disaster for anyone but the early investors. I would now go so far as to say, it’s not clear whether there is a long term future. And that’s even before we get to the negative outlook for oil in the medium term.
An Inside Job – Noble Energy’s explanation
This was particularly brought home to me when looking at the presentation made by Noble Energy in explaining to its investors why it has agreed to be bought by Chevron.
Noble Energy has a market cap of about $US4 billion (about 60% of Santos’ market value). In the presentation they made, the back half stands out for its recognition of the problems facing the industry. The presentation of the problems is particularly powerful because it comes from inside the industry. And that’s why its so powerful.
I don’t want to just cut and past slides, so I’ve recreated some from data provided by Noble and cut and paste a couple of others. Here is the summary of the issues as presented by Noble:
– Industry remains overleveraged and struggles to deliver shareholder returns;
– US shale faces looming debt maturities over the next decade;
– Industry characterised by high decline rates and increasing break-evens;
– The large cap E&P sector is struggling to attract capital as scale is increasingly important for investors;
– Cost of capital continues to rise across the industry;
– Investment grade rating and scale are key value differentiators across the industry, with large cap independent E&Ps particularly at risk for negative ratings actions;
– ESG is now a key tenet of investing, likely leading to reduced capital availability for E&P sector; and
– Increasing investor concern on longer-term fossil fuel outlook.
Let’s look at some of those points. The sector free cash flow, that is profits less capital reinvested to keep production steady or grow production. This is the main puzzle. Of course you have to invest capital before you get the product and sell it. Investors happily bought that story for a decade. But at some point you need to be able see a return on capital.
In this sector the key issue is that every year more capital has been invested but the returns haven’t lived up to the requirement. Now, by and large, we have all come to realise that the returns aren’t there.
Why should the Australian taxpayer be going down this path? Is it because, like the Australian submarine program, we just want to throw away money? Is it because the policy is written by gas industry executives? Or is there some other reason as yet unexplained.
Figure 2 Source: Noble Energy, “Large cap” is USA large cap.
And this next is cut-and-paste, but illustrates how the industry cost curve is likely to increase over the next 5-10 years. That’s despite all the productivity work that the industry endlessly talks about. EG: Pad drilling, feet drilled per dollar of capex, etc. To me it’s one of the most important charts in the presentation:
Figure 3 Source: Noble Energy
Everyone has done badly but leveraged equity is worst.
Figure 4 Source Noble Energy, broad E&P sector shares
If the sector was doing well $US70 billion of debt wouldn’t be hard to refinance. But for this sector it won’t be that easy.
Figure 5 Source: Noble Energy
Nearly all debt agency rating moves in the past six months have been negative.
The oil price and sector market cap slides I take directly from Noble again. The five year WTI futures strip is not to be taken as a forecast, it mostly reflects the near-term price and the cost of storing oil. The sector market cap has gone from $US160 billion to $US30 billion and from a useful part of the S&P 500 to irrelevant.
Figure 6 Source: Noble Energy
Regarding LNG I don’t repeat Noble Energy’s slide, instead I point to an article in the AFR which noted that Qatar has been aggressively chasing LNG contracts for its planned expansion. Qatar has enormous LNG reserves. The article said that these reserves were being sold on an oil gas slope of 10%.
In Australia, the Queensland LNG industry was contracted on a slope of 13-14%, maybe even 15% for GLNG’s first train. If your oil price forecast is $US50/barrel a 10% slope works to a price of about $A6.80 GJ +- shipping to destination. No Australian producer has a hope in hell of justifying a new LNG train at that price.
Finally I’ll finish with one more slide from Noble Energy that reflects their view of the environmental, social and governance outlook.
Figure 7 Source: Noble Energy
Go, go Angus, you can pick winners alright.


