The scale of battery adoption we’ve seen since July, 2025, when batteries became eligible for Small-Scale Renewable Energy Scheme (SRES) support, is running at a pace that could completely transform Australia’s energy market.
It is equivalent to rolling out a scale of power capacity equivalent to the Snowy Hydro-Electric Scheme in just a single year.
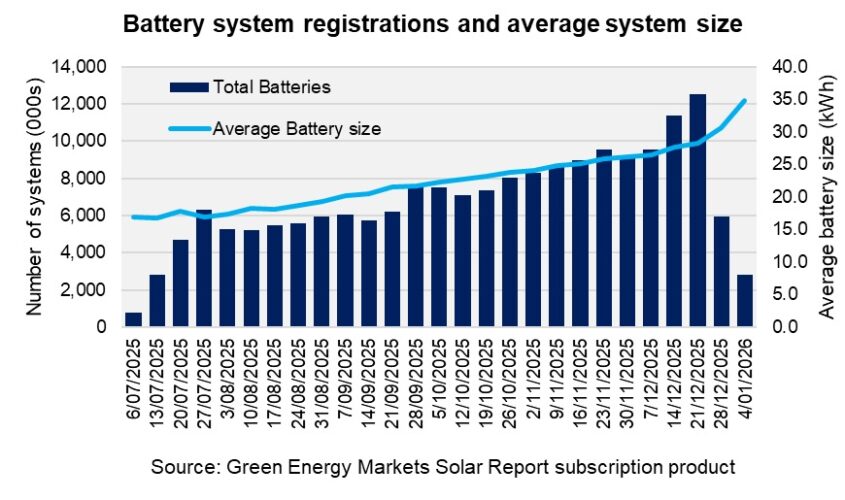
The chart below, taken from Green Energy Markets’ solar and battery market tracking subscription product – the Solar Report – shows that after an initial stalling in system installation numbers over August and September at around 5000 to 6000 systems per week, it then achieved steady growth.
By the week just before Christmas it had broken through 12,000 systems for the week. In terms of the storage capacity of those batteries this has also risen steadily.
In the years before batteries became eligible for SRES rebate the typical residential battery system size was around 10 to 15 kilowatt-hours (kWh). At the commencement of the battery STC rebate program batteries were averaging about 16 kilowatt-hours. By the end of December the average system being registered was 29 kilowatt-hours.
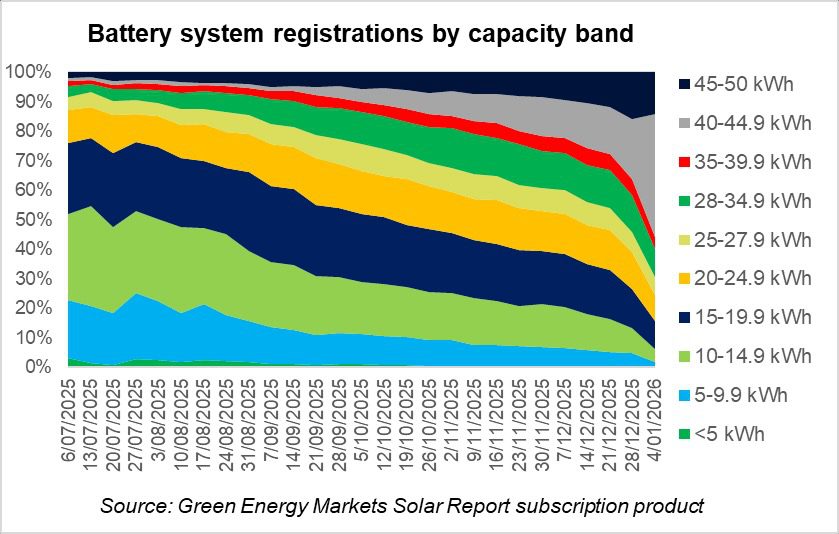
The chart below from our Solar Report subscription product illustrates how the market has rapidly evolved from 70% of systems being below 20kWh (and around 50% below 15kWh), to now 70% being greater than 20 kWh.
The chart below from our Solar Report subscription product illustrates how the market has rapidly evolved from 70% of systems being below 20kWh (and around 50% below 15kWh), to now 70% being greater than 20 kWh.
Note, however that the post-Christmas surge in the 40 to 44.9kWh grey section was a temporary, holiday period, aberration.
By the end of the 2025 calendar year Australia had installed slightly over 183,000 systems with 4,259 MWh in storage capacity.
So what can we expect for the remainder of the 2025-26 financial year?
I’m not confident in predicting numbers here. Our forecasts prepared for the Australian Energy Market Operator and published in November already look to be a significant underestimate, although as consolation we look to be the least wrong out of the three modellers.
Under the Step Change scenario we forecast that around 9,000 MWh would be installed over the 2025-26 financial year, while CSIRO forecast 4,000 MWh.
We’ve already gone past 4,000 MWh and there’s almost another 6 months to go before the end of the year, so we can safely put the CSIRO forecast aside. But 9,000 MWh is almost certainly too low as well.
As shown in the first chart above, the clear trend since July has involved steady growth in average installation numbers per week as well as average system size.
But even if we were to assume that growth trend halted and instead the industry stalled at the weekly average installation numbers they achieved across November and the pre-Christmas December period, that’s close to 10,000 systems per week.
So far over January we’ve fallen a bit short of this, with 8,856 systems installed in the week beginning 5 January. But this is likely dragged down by many people still being on holiday.
We’ll probably ramp up installation numbers above 10,000 per week over mid-March to the end of April as the market seeks to rush in before the large drop in the level of the STC rebate due in May.
That large drop in the rebate will no doubt push installation levels down, but we suspect they’ll remain reasonably healthy over May and June. This is because we’ve seen in the past that solar businesses can use a forthcoming scheduled step down in STCs as a way to cajole customers to commit to a sale for fear of missing out.
Solar businesses will use this sales technique even if they know they won’t be able to get the system installed before the rebate steps down, because they’ve adjusted their pricing to the customer to ensure a reasonable profit even with reduced value from STCs.
Essentially, we expect that solar businesses are likely to build-up an order book over the next few months prior to the STC reduction in May which will then keep them busy up until the end of the financial year.
So while there’s plenty of uncertainty, 10,000 systems per week on average to end June looks very achievable. That would deliver a total of almost 450,000 battery systems for the 2025-26 financial year.
As a lower bound it seems unlikely installations would average less than 9,000 systems per week and there’s certainly plenty of scope for installations to be higher than 10,000.
In terms of what this means for storage capacity, the average size of battery being installed has been growing by around 1.7% per week since August and has now reached 29 kWh.
If this growth rate were to continue then by the end of April we’ll have reached 37kWh average system size, which I’m not sure is realistic. So let’s be a bit conservative and assume the growth in system size slows to 1% per week instead. That would land us at an average system size by end of April of 33.5 kWh.
How much system sizes will fall as a result of changes in the rebate in May is hard to predict.
However, given the significant economies of scale savings from adding more kilowatt-hours, we suspect the solar industry will be able to persuade customers to go beyond the 16kWh size threshold at which the rate of STCs per kWh significantly drops.
For the purposes of this estimate, let’s assume average system size falls to 20kWh over May and June, acknowledging this is highly uncertain.
The end result of these assumptions in terms of weekly battery storage capacity is illustrated in the chart below. This would give us almost 11,500 MWh of battery capacity installed over the first 12 months of the Cheaper Home Batteries Program.
In terms of megawatts of instantaneous maximum capacity (not megawatt-hours), we don’t have access to data on the typical inverter size being coupled to batteries unfortunately (something for the Clean Energy Regulator to look at publishing?).
As a very rough rule of thumb we suspect the kilowatts of the inverter are probably somewhere around a third of the kilowatt-hours. So that indicates these batteries could put out a maximum of 3,800 megawatts in aggregate.

450,000 battery systems, capable of providing 11,500 MWh per day and 3,800 MW, all installed within 12 months – these are meaningful numbers relative to the scale of Australia’s electricity market.
To put it in perspective the Snowy Hydro-Electric Scheme delivers a daily average of 12,300 MWh of electricity and has maximum aggregate capacity of 4,100 MW. So we’ve delivered something in power terms roughly equivalent to the Snowy Scheme, but in just a single year.
The changes the Federal Government announced in December last year to scale-back the level of the rebate support (which commence in May this year), likely mean this feat won’t be repeated in the 2026-27 financial year.
However, the program has kick started the home battery market to a level of scale and competition that has led to a significant fall in system pricing thanks to new entrants. This should hopefully mean that home batteries will continue to be installed at the rate of hundreds of thousands.
One caveat though – the recent proposal by the Australian Energy Market Commission to force households to pay for networks based on an unavoidable, fixed fee, instead of one based on a household’s electricity demand, is clearly designed to kill the solar and battery market stone dead. If energy ministers were to accept this proposal then both solar and battery adoption would collapse.
Tristan Edis is Director of Analysis and Advisory at Green Energy Markets. Green Energy Markets assists clients to make better informed investment, trading and policy decisions in energy and carbon abatement markets.