Graph of the Day: Solar power’s massive cost drop

Cleantechnica

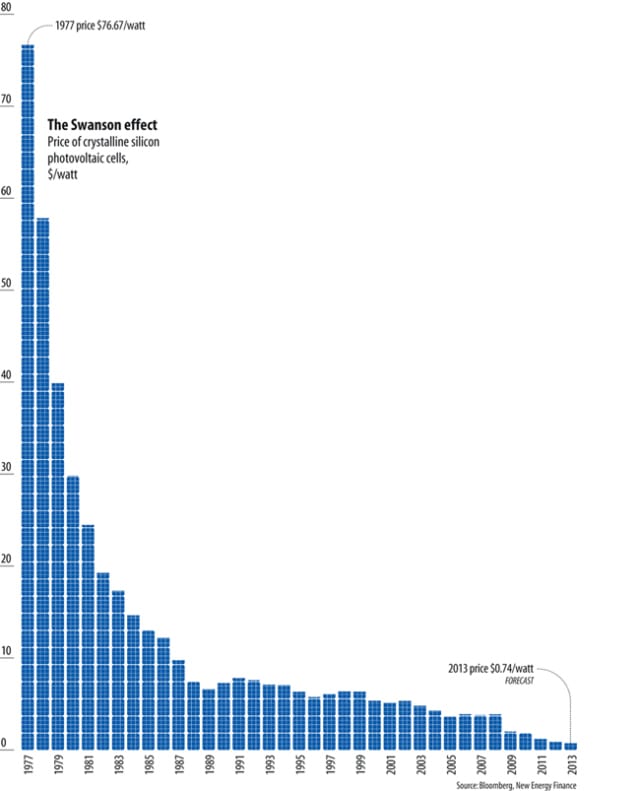
This graph on the declining costs of solar power is another of Cleantechnica’s excellent “cleantech snacks”.

We’ve published many a graph showing the sharp fall in solar PV costs over the last four to five years (80 per cent by most calculations) but here is a wonderful illustration of how far the costs of solar have fallen since 1977.

price of solar power drop graph


This article was originally posted on Cleantechnica. Re-produced with permission.

Comments

3 responses to “Graph of the Day: Solar power’s massive cost drop”

  1. Kristen Avatar
    Kristen

    Is this in Australia or worldwide? Thx

  2. Giles Avatar
    Giles

    Worldwide

  3. Louise Avatar
    Louise

    I am a customs broker and I have processed shipments from China to Australia with prices as low as US$0.45 per watt, FOB.

    For inverters, I have seen prices as low as US$110 per kW inverter capacity, FOB.

    Apparently, there might still be room for further cost reductions.

    “The companies can introduce thin-film technology to their glass-manufacturing lines and produce modules at about 30 cents a watt or less, according to Dieter Manz, Manz’s chief executive officer. The Reutlingen, Germany-based company makes machines that produce flat-panel displays and solar products.”
    http://www.bloomberg.com/news/2012-06-15/lcd-makers-may-enter-thin-film-solar-market-manz-says.html

Get up to 3 quotes from pre-vetted solar (and battery) installers.