Cleantechnica
I write about solar and wind power obsessively, almost every day. Still, the latest numbers from the Federal Energy Regulatory Commission’s Office of Energy Projects came as a bit of a surprise to me. Over 28 per cent of new US power capacity in the March quarter was from large-scale solar installations (small- and medium-scale installations would actually boost solar’s percentage of the pie considerably, but they’re harder to track and count). Wind power accounted for nearly 51 per cent of new power capacity (and this is just after the rush to get projects completed before the wind power production tax credit expired).
More details in the post below from Solar Love:
Renewables are leading again. The Federal Energy Regulatory Commission’s Office of Energy Projects has just released a report for the first three months of 2013.
The report is called the “Energy Infrastructure Update” and it shows that renewable energy sources (biomass, geothermal, solar, water, wind) have accounted for 82% of all new domestic electrical generating capacity installed in the United States for the first quarter of 2013. The total amount of the combined renewables came in at 1,546 MW.
So far this year, coal, nuclear, and oil have provided no new generating capacity, which is good news to say the least. Natural gas came in with 340 MW of electrical generating capacity installed for the first quarter of 2013.
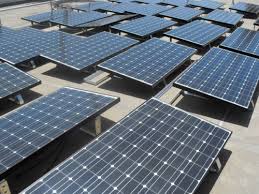
The breakdown of the report put wind energy in the lead for quarter one, with 6 new “units” totaling 958 MW. Second place went to solar, with 38 units totaling 537 MW accounting for over 28% of new power capacity in Q1. (Obviously, this doesn’t include small- or medium-scale solar installations, which account for about half of all US solar power capacity.) During the first quarter of 2012, solar only installed 264 MW, so this year solar has more than doubled its newly installed capacity (537 MW).
The big winner in renewables for the month of March was solar, which produced 100% of the new electrical generation capacity, with 7 new units with a combined capacity of 44 MW in California, Nevada, New Jersey, Hawaii, Arizona, and North Carolina.
In the past couple of years, the installed price of solar has dropped about 40%. This has certainly spurred on a good portion of the growth, but the price is projected to fall much more in the coming years. So what lies ahead?
One of the other key players in the renewable mix in quarter one was biomass, with 28 units that totaled 46 MW. And even water was in the picture for the first quarter, with 4 new units with an installed capacity of 5.4 MW. Geothermal is lagging behind so far this year with no new capacity reported. Here’s a full table:

Nearly 16% of total installed US generating capacity now goes to renewable energy sources. Here’s a break down of the current installed generating capacity from the report:
- Water — 8.53%
- Wind — 5.18%
- Biomass — 1.3%
- Solar — 0.44%
- Geothermal — 0.32%
For a comparison, that is more than these combined:
According to the US Energy Information Administration, the actual net electrical generation from renewable energy sources in the United States now totals a bit more than 13%. (Just a note since generating capacity is not the same as actual generation.)
It is clear, however, that renewable energy sources continue to dominate the new electrical generating capacity being brought on-line in the United States. It seems like with every one of these reports it becomes clearer that coal is slowly fading away and a cleaner future is on its way with renewables.