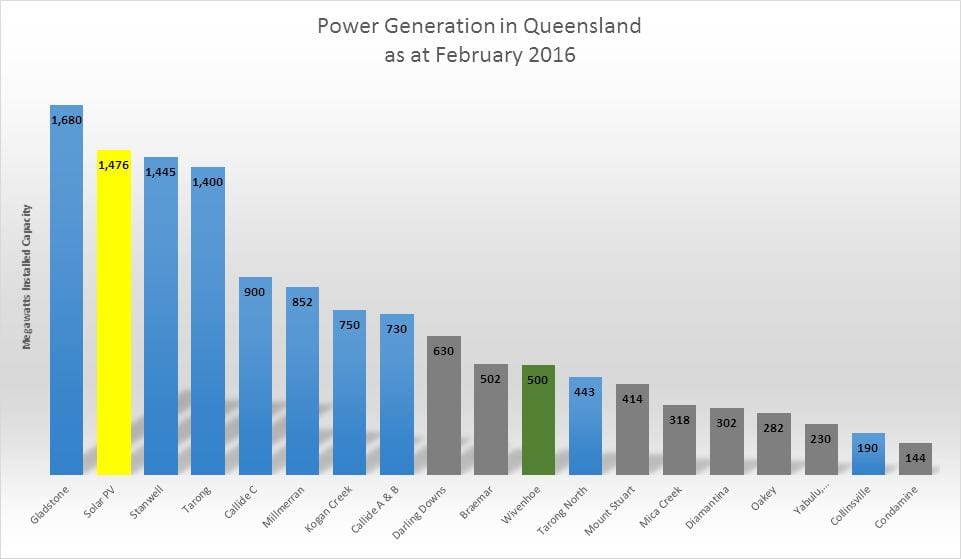
A couple of weeks ago we brought you news that rooftop solar capacity in Queensland has passed 1.45GW, making it the second largest generator by capacity in the state, and will soon be the biggest.
Now, we have the graph to illustrate it. It has overtaken Tarong and Stanwell coal plants and sits behind only the Gladstone coal-fired plant. Energy minister Mark Bailey expects solar to reach number one soon enough, although at current additions of around 15MW a month, it will probably take a year or so.

The colouring illustrates just how far Queensland needs to travel to clean up its energy supply. There are no single wind or solar plants of more than 12MW in the state, although there are a bunch of projects that could be developed in coming years. And these will be needed to meet the Labor government’s 50 per cent renewables target.
Energex this week updated its data for February, noting that it now has more than 300,000 homes and businesses with more than 1.05GW installed in its network, which covers the state’s south-east corner.

In the last month, 1665 new systems were connected to the network, adding 11.8MW, taking the total to 304,428 systems with installed capacity of 1,056MW.
The blue line shows the number of those on premium tariffs – now down to 183,000 after another 759 systems were bumped off, either due to upgrades or house sales. There are 118,418 systems on the market-based feed-in-tariff, which pays less than 6c/kWh (red lines). Another 1,920 applications were received from customers in February.
There is now rooftop solar on 2.9 out of every ten homes in south-east Queensland. Together, they produce around 7.4 per cent of annual demand.