America’s Federal Energy Regulatory Commission (FERC) has released its latest Energy Infrastructure update to reveal that renewable energy sources combined to provide more than three-quarters of the nation’s new electrical generating capacity in the first three months of the year.
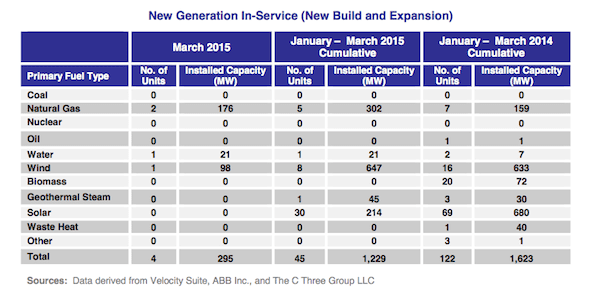
A combination of wind, solar, geothermal and hydropower together provided over 75.43 per cent of the 1,229MW of new generating capacity placed into service during the first quarter of 2015, according to FERC. The balance (302MW) was provided by natural gas.

As you can see in the chart, the star of the quarter was wind energy, with eight new “units” – 647MW – accounting for 52.64 per cent of all new capacity for the quarter, including Hoopeston Wind’s 98MW project in Vermilion County, Illinois.
This was followed by 30 units of solar (214 MW), one unit of geothermal steam (45 MW) and one unit of hydropower (21 MW). FERC reported no new capacity from any from coal, oil, or nuclear power.
This means that in the US, renewable energy now accounts for just under 17 per cent of total installed operating generating capacity – that’s more than nuclear (9.11%) and oil (3.92%) combined. Total installed operating generating capacity from solar has now reached and surpassed the one-percent threshold.

According to December 2014 data from the US Energy Information Administration, actual net electrical generation from renewable energy sources now totals 13.2 per cent of total electrical production; but the SUN DAY Campaign notes that this figure almost certainly understates renewables’ actual contribution because the EIA does not fully account for all electricity generated by rooftop solar.
“The trend lines for the past several years have been consistent and unmistakable,” said Ken Bossong, Executive Director of the SUN DAY Campaign. “Each month, renewable energy sources – particularly wind and solar – increase their share of the nation’s generating capacity while those of coal, oil, and nuclear decline.”