A generation ago Jimmy Carter was in the White House, donning sweaters and telling Americans to turn down the thermostat. In the 35 years since, global emissions have almost doubled, from 18 billion metric tons of carbon dioxide a year in 1980 to almost 32 billion in 2011, the latest year available.
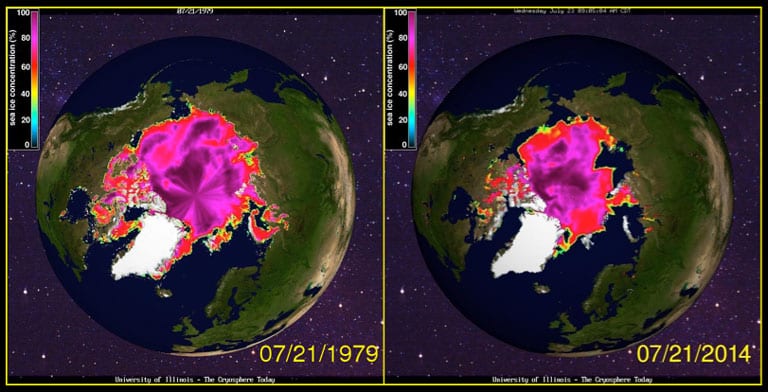
 The impacts are increasingly being felt everywhere – bigger storms in the Midwest, soggy summers in England, drought in Colorado. But nowhere on the planet are the impacts as dramatic as the Arctic, and the ice cap is a prime example.
If you’re sweltering in New York or Miami or Los Angeles, the only ice you’re probably thinking about is the stuff melting fast in your drink.
But up in the Arctic, the ice pack is on pace for another record low. Scientists won’t know for sure until mid-September, the end of the North’s melt season. But two snapshots, one from July 21, 1979, the other from July 21, 2014, show the change.
Source: The Daily Climate. Reproduced with permission.


