In what is, to be sure, a seasonally weak part of the year, spot prices have fallen very sharply compared to the previous corresponding period (PCP) and are mostly in the $40/MWh mark

The lower spot prices are also feeding into lower futures prices, where FY21 for instance has fallen by around 1/3 over the past 6 months. Fig 2 shows that trading in FY21 started as early as say August 2018 so to my mind futures prices do contain information some distance out.

Lower prices are great for consumer profits, but bad for new renewable investment and potentially bad for carbon emissions as they incentivise consumption. At least that’s my view.
Volumes are not really showing an unambiguously steep fall. Indeed QLD volumes appear to be up in the past 7 days. Compared to the past five year average though total in front of the meter = operational volumes for the calendar year to date are down about 2% on PCP, continuing a long standing trend.

In my opinion volumes are holding up because much of Australia’s electricity consumption is in heavy industry which has not been heavily impacted by the virus. Coal mining, for instance, is a significant source of electricity demand.

Finally if we look at the data, near and dear to my heart, it’s the renewables penetration and reduction in coal generation. We start to move into shorter daylight hours. The end of daylight saving time is a disadvantage to smoothing demand as where previously some QLD solar supply was conceptually available into the start of the NSW early evening peak, that no longer happens. On the other hand wind starts to become seasonally stronger.
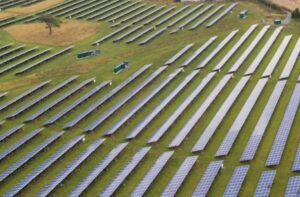
Utility solar’s growth has disappointed this year, partly due to the ongoing schemozzle in the NEM.