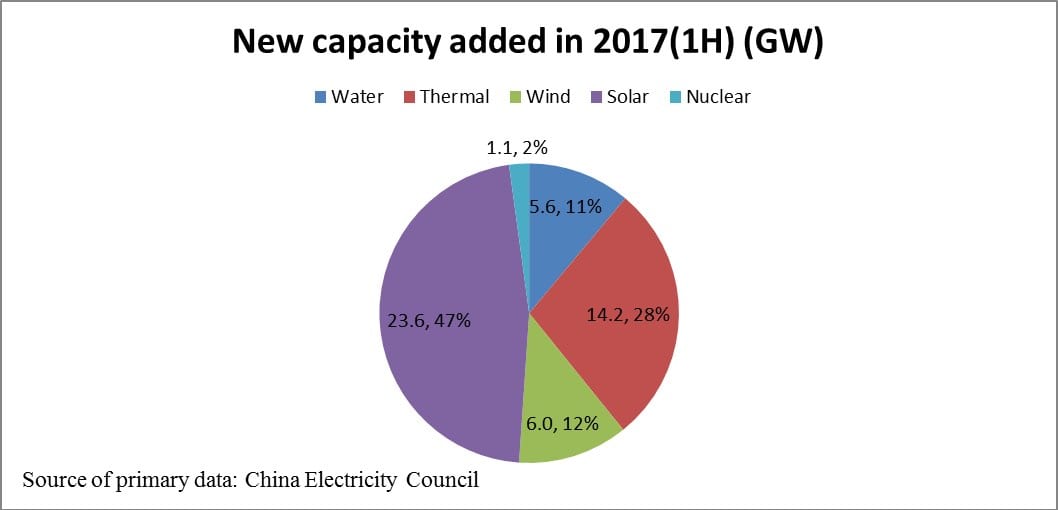
China’s energy-related agencies, the National Energy Administration (NEA) and the China Electricity Council (CEC), have released data on the operation of China’s electric power system in the first half of 2017 (1H 2017), noting that renewable sources (water, wind and sun) accounted for just on 69.8% of new capacity added, with thermal sources (mainly coal) accounting for 28%, and nuclear for just on 2% (Fig. 1).
These results reveal a marked shift towards green sources of electric power, when compared with the 2016 data which show that renewable sources (WWS) added 51.9% of new capacity, while thermal accounted for 42.9% and nuclear for 5.2%.
The first half results for 2017 thus reveal that the electric power system is continuing its green shift, edging closer to placing more reliance on WWS sources at the margin, with WWS sources increasing their influence and thermal sources declining in proportion.
The trends therefore continue those analyzed previously by Dr Hao Tan and myself (http://apjjf.org/2017/10/Mathews.html).
The 2017 data also reveal that the absolute numbers of new capacity additions are down on 2016, with total capacity added in 1H 2017 standing at just 50.6 GW, compared with 124.6 GW capacity additions for the whole of 2016. This is consistent with a general cutback in investment levels across the economy in China in 2017.

Meanwhile the data for investment made in 2017 (1H) released by CEC reveal a continuing preponderance of investment in WWS-sourced generating plant vs thermal sourced plant.
New investments made in power plans in 1H 2017 amounted to RMB 104.6 billion (US$ 15.9 million) — with RMB 55 billion (52.6%) of investment in new generating plant being sourced from WWS compared with only RMB 31.3 billion (29.9%) for thermal sources.
The data also reveal that RMB 18.3 billion (17.5%) of investment in new power generation was directed to nuclear power systems – a shift from previous years’ proportions.
By contrast with the capacity additions in 2017 1H, the actual electrical energy generated over the first half of the year stands at just under 3000 TWh (which is comparable pro-rata with the generated amount in the year 2016), with WWS sources accounting for 21%, nuclear for 4% and thermal for 75%.
This may be contrasted with the 2016 full-year results, which were that thermal accounted for 71.6%, WWS sources for 24.8% and nuclear for 3.6%.
Thus in terms of electricity generated, the year 2017 has so far seen an increase in the proportion of thermal power generated and a corresponding decrease in WWS power, with nuclear marginally increasing its proportional contribution.
This result reflects the continuing strength of fossil fuels in the total electric power system, and is also likely to be the effect of continuing curtailment of renewable sources (i.e. generating power but not contributing to the grid) – as discussed in the final section below.
The system is greening at the margin (in terms of new additions) but it still remains a large fossil-fuelled system.
The situation at the close of the 1H 2017 for the three aspects of the electric power system, encompassing capacity additions, electric energy generated and new investments, over the period of the first half of the 13th Five Year Plan (2015 – 2017 (1H)), with data for 2010 included as comparison, is shown in Table 1.
It is worth noting that different definitions of ‘clean energy’ can lead to varying estimates of China’s green shift.
For example reports in the China press in July that China’s ‘clean energy’ generation in 1H 2017 reached 27.2% of total power generation are at variance with the estimates given here (see for example , ‘China’s clean energy generation accelerates in first half’, China Daily, 19 July 2017, at: http://www.chinadaily.com.cn/business/2017-07/19/content_30167029.htm).
The estimates cited here are based on CEC data and a characterization of ‘clean’ as meaning energy generated from WWS sources.


When we turn to examine new capacity additions and investments in WWS sources in 2017 (1H) we see that the green shift continues to operate at a level that far exceeds what is found elsewhere in the world.
Solar
The 23.6 GW new solar PV capacity added in 2017 (1H) is another world record for China, taking the cumulative installed capacity to 101 GW by end of June 2017 (and to 112.3 GW by July 2017– which is already above the (conservative) target of 105 GW set for 2020 by the ND&RC in its 13th FYP for energy).
Some observers like the AECEA see China’s solar PV installations as likely to top 40 GW in 2017 for the full year (https://www.pv-magazine.com/2017/08/22/aecea-china-installations-to-surpass-40-gw-in-2017).
The AECEA sees the 2020 cumulative total for China as likely to reach 230 GW, which would dominate the global picture.
Now the NEA in China in August has acted to raise the target for solar PV in China by 2020, setting a new target of 213 GW – or a doubling of the previous target total, which is already five times the current installed capacity in the US (https://www.ecowatch.com/china-solar-target-2476947208.html).
This means that the AECEA projected target for 2020 is in line with official Chinese targets.
Greenpeace also notes that China plans by 2020 to have installed no less than 54.5 GW of large-scale solar projects, encompassing Concentrated Solar Power (CSP), solar PV and combinations of solar and food production systems (https://www.ecowatch.com/china-solar-target-2476947208.html). Greenpeace capture the situation with solar PV as shown in Fig. 2.

Wind
The 6.0 GW new capacity added for wind in China for 2017 (1H) – or 1 GW per month (equivalent to 400 new turbines built and erected, rated at 2.5 MW each).
This is a 4.7% increase on the pro rata figure for 2016, which saw wind capacity additions reaching 17.3 GW, and the cumulative total reaching 154.6 GW, easily the largest in the world.
According to Greenpeace, China is on track to install 110 GW onshore wind capacity by 2020 – raising cumulative wind capacity to 259 GW, well in excess of the 210 GW target set for the end of the 13th FYP period in 2020. The situation for wind power capacity and generation is depicted in Fig. 3.

The total solar and wind capacity would exceed 400GW by 2020, according to the latest NEA plan, as shown in Fig. 4.

Hydro
Meanwhile hydro continues to expand at a moderate rate in China, with the 5.6 GW capacity added in 2017 (1H) representing a 28% increase on the pro rata figure for 2016 of 4.37 GW new capacity additions.
The cumulative total for hydro at the end of 2017 (1H) stood at 340 GW, meaning that China has already installed hydro to the target level for 2020. This must be close to the absolute limit for China, given that there is a natural limit to the widespread damming of rivers.
Competing sources of electric power: WWS versus Thermal
There is a major struggle now under way in China between the interests backing renewable sources (mainly hydro, wind and solar) and those continuing to support thermal sources for power generation (mainly coal but also gas and a very small amount of oil).
China’s problem is to allow the renewable sources of grow while reducing the activities of the thermal power sector in a socially responsible way.
During the first half of the 13th FYP, running from 2015, 2016 and 2017 (1H), new capacity of 152.4 GW based on thermal sources was added as against 169.2 GW for renewable sources (hydro, wind and sun). So over this period WWS outranked thermal sources by 111%.
The advantage in favour of WWS sources was even more exaggerated when examining investment, with investment in thermal sources over the first half of the 13 FYP accounting for RMB 265 billion, as against RMB 450 billion for WWS, or WWS favoured over thermal to the extent of 170%.
Over the same period of the first half of the 13th FYP, WWS sources accounted for 55% of the new capacity added – making it clear that the trends revealed in Fig. 5 may be expected to continue.
Meanwhile the total power system has moved in a steady green direction, with the proportion accounted for by WWS sources reaching 35% by 2017 (1H), up from 34% in 2016, as shown in Fig. 5.
What is worth noting is that China’s WWS as a proportion of total electric generating capacity has expanded in just 10 years from 20% to 35% — a 15% swing in just a decade.
This is a truly amazing swing in the largest electric power system in the world. At this rate, China’s electric power system will be expected to reach 50% green capacity (WWS) within another decade, by 2027, i.e. well before 2030. Carbon emissions will be expected to fall accordingly.


Source: Based on data from the CEC
Negative influences
There are some negatives to set against all these positives. Apart from the continued burning of large volumes of coal, there is the issue of curtailment, or failure to connect wind and solar power farms to the grid and so allowing them to generate unused electric energy.
Greenpeace notes that in 2017 (1H) the national wind curtailment rate stood at 13.6%, and solar curtailment in five northwest provinces at 15.5%.
The NEA acknowledges the problem, and has announced steps to deal with it. First, the NEA has ruled that provinces with serious wind and solar PV curtailment problems (such as the western provinces of Gansu, Xinjiang and Ningxia) may not install any more new capacity.
This would have the effect of nudging these provinces to make better use of the capacity already installed.
Second, the NEA identifies seven provinces (including Beijing and Shanghai) as being released from controls and becoming free to add as much solar capacity as they wish, subject only to the constraint that they must not make the curtailment problem any worse. (https://www.ecowatch.com/china-solar-target-2476947208.html).
“Acknowledgment: I would like to acknowledge the valuable contributions made by Ms Carol Huang to this article. JM”
Source: Global Green Shift. Reproduced with permission.