Batteries are making great progress in the USA
Recently there have been a variety of press releases and company statements showing the use of batteries, often coupled with solar plants, as an alternative to gas.
The most recent of these was the announcement by the Los Angeles Department of Water and Power that they plan to seek approval of a two phase 25 year PPA priced at US$19.98 MWh for 400 MW ac/530 MWdc plus an adder of US $13 MWh for a co-located 400 MW/2 hour storage system. There is no price escalator. The project is not due to deliver power until 2023. So its not today’s price.
I’d make a couple of initial observations:
- Longterm PPA 25 years. At two recent conferences I’ve heard presenters saying the age of the PPA is over. Personally I think that’s wrong. There is nothing like a long term PPA from a reputable counterparty to get final prices down.
- Solar and battery capital costs will surely be lower in 2022 than they are today
- It doesn’t seem to me that the project will qualify for much in the way of ITC support as that phases down
Listen up. Here’s what Nextera is doing
Perhaps even more convincing is news from Nextera, the world’s most successful utility at its recent investor day presentation. Nextera consists of two businesses, it’s the main integrated utility in Florida, and it owns a large, and very rapidly growing, portfolio of wind and solar plants. You can have a great time reading the nextera presentation.
Most enjoyable read I’ve had since the election. Although I mainly want to focus on their storage comments I can’t help but observe their published plan, and this is a $94 bn mkt cap company is to grow their wind and solar portfolio from 18 GW in 2018 to wait for it to about 30 GW by 2022 growing their ebitda at a CAGR of 15% in that time. Back to storage:
Here is one slide reproduced. This is Florida not California and it’s the rate paying utility rather than the generation business.

And here’s another slide extract. Normally I try not to reproduce the slides of others but sometimes the branding is important. These forecasts are from Nextera itself, a business that has growing is market capitalization from US$12 bn to US $94 bn over the past 15 years and knows more about this stuff than just about anyone. Nextera produces 47 TWh of wind and solar making it number 1 in the world at this in 2018.

Nextera expects wind to have an unsubsidized LCOE in the USA in 2022 of about US$15 MWh and solar about US$27 MWh. These numbers are for long term PPAs and take account of the low cost of capital those PPAs bring. Even so they are fantastic numbers coming from the industry’s leading producer.
Nextera goes on to state at slide 132 that a four hour battery storage “adder” equal to 25% of the nameplate solar capacity even in 2018 adds US$12 MWh to cost and by 2o22 this is expected to fall to about US$7 MWh. The capital cost assumed for the fully installed battery pack in 2018 is US$400 kWh. That is the BNEF estimate of pack cost of US$200 kWh x 2. Those numbers are in line with numbers ITK published in our recent note looking at battery costs.
Battery economics are not as good as the headlines yet
Despite all this good news coming from the USA and the breadth of projects now and the quality of the sponsors, ie Nextera, makes the reality of it fairly much undeniable, the economics are still far from obvious.
Lets start with a 4 hour battery and use Nextera/BNEF cost estimate of US$400/kWh installed. In A$ that’s $570 kWh.
Lets also assume away maintenance capex and assume the battery is good for 7500 cycles, ie one cycle a day for 20 years.
Finally lets assume the power to charge the battery comes for free. One way a small battery could work this way is by using energy that would otherwise be clipped and spilled each day at a utility solar farm. There would be more of this in Summer and less in winter etc but lets assume the energy recharge cost is free in this simplest example
Even so we have to allow for only discharging the battery to at most say 85% of rated capacity and round trip efficiency of say 90% (better than pumped hydro but not 100%). For a 10 MW/4 hour battery we estimate net revenue of A$ 145 MWh needs to be earned to get a 6.0% ungeared IRR. If we assume a 12% per year decline then by 2022 we will be down at around $100 MWh.
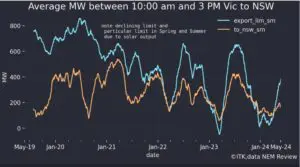
To put that $145 mWh and $100 mWh in context here are the average daily price curves in FY19.

If we summarise these charts by counting the average number of half hours that the price per region was >X we get:

In South Australia and Victoria in FY19, assuming you paid nothing for your input power there were 5 hours a day where you could earn your target price. This excludes any other revenue the battery might earn such as FCAS and it excludes the role of the battery in smoothing power for say cloud interruptions. The battery may also contribute to system strength. However it’s an optimistic set of assumptions.
Relating the $145 or even the $100 back to the Nextera numbers we would divide by four as the solar plant is only sized at 25% of the solar plant size. So that would give $36 mWh in 2018 to be added to the solar price and $25 mWh in 2022. These numbers are still higher than Nextera estimates.
Also you can’t get 25% clipped energy from a solar farm, at least I don’t think you can, more like 5%-15%. So for a battery added to solar farm that’s 25% of the AC capacity of the solar farm you will need some solar panels which are more more or less dedicated most of the time to charging the battery. We estimate those panels probably bifacial and certainly tracking would cost around A$1 -A$1.20/ watt in 2019 installed. Obviously this lifts the required electricity price.
In short we can’t see how they make it work in the USA but we have no doubt they do.
What is the market telling us? In the USA batteries are clearly gaining ground. In Australia there are something like 200 mWh of batteries installed but in general despite the really high price of gas and the high price of electricity we don’t see many batteries being installed for arbitrage. This suggests our numbers are probably right. For reasons I don’t fully understand the numbers are there in the USA but not in Australia.
As a final thought, I’d note that by and large the USA has not separated out generation from wires and poles. The utilities are still largely vertically integrated. Whatever the rights and wrongs of the matter I increasingly believe that capturing system wide values is easier when you are vertically integrated.
A battery can do many jobs all at once, provide power, improve system strength, provide FCAS, reduce the need for distribution system augmentation and capex as well as energy arbitrage. Getting paid for all of those services or even getting them valued in the Australian context is very difficult.
That’s because Australian regulators are besotted with bizarre ideas like nodal MLF pricing. Never mind common sense when you can have a theoretical approach. Still that’s for another day.